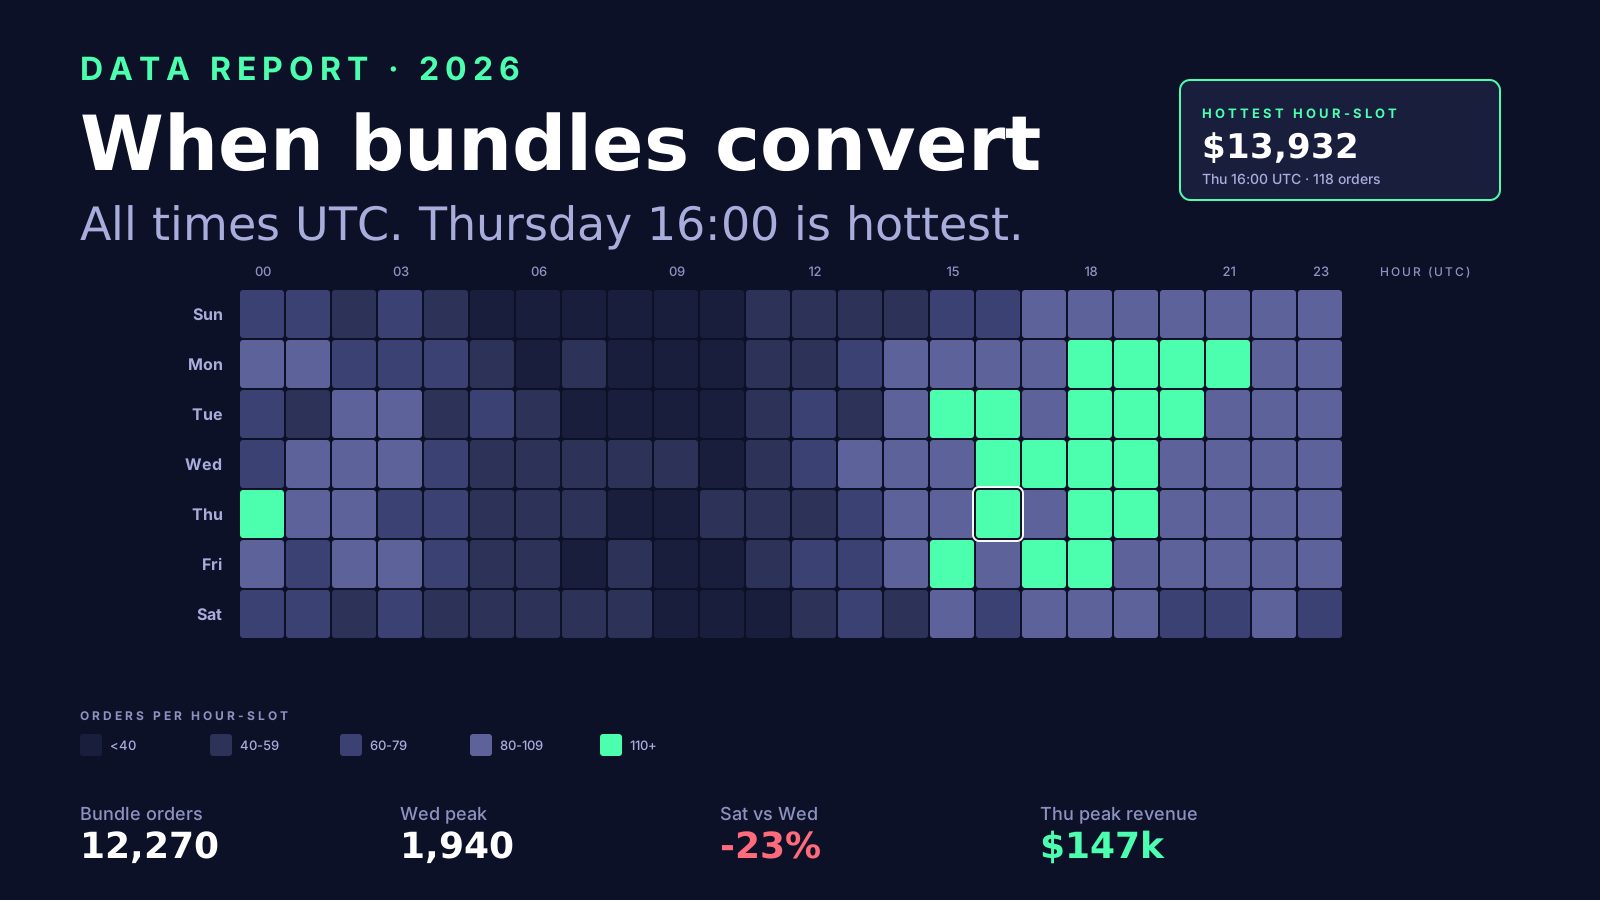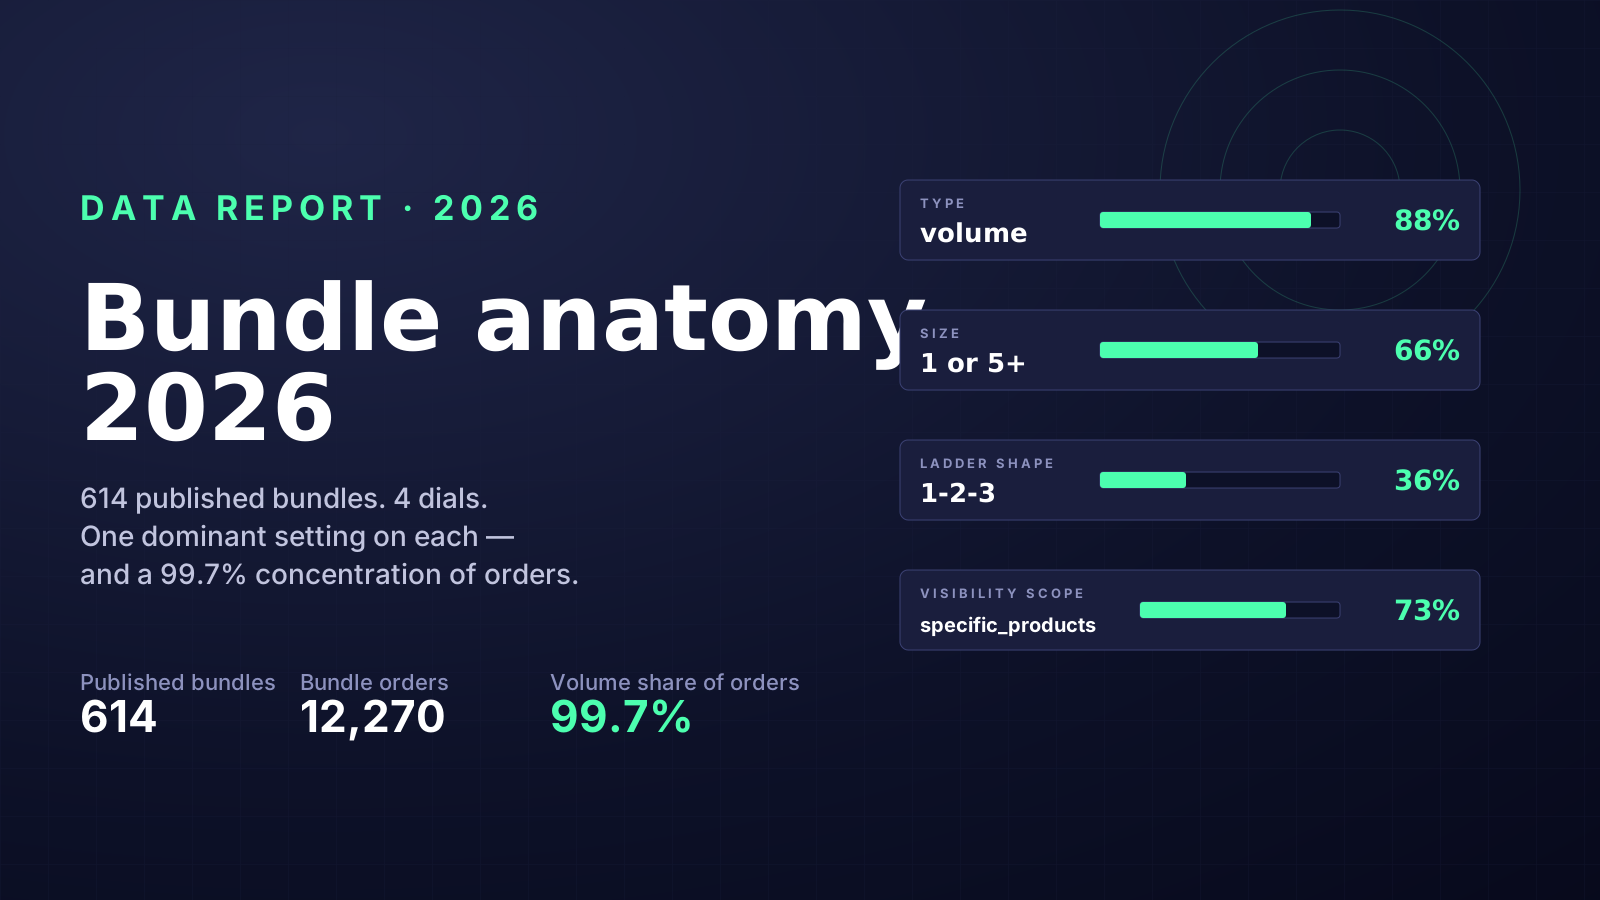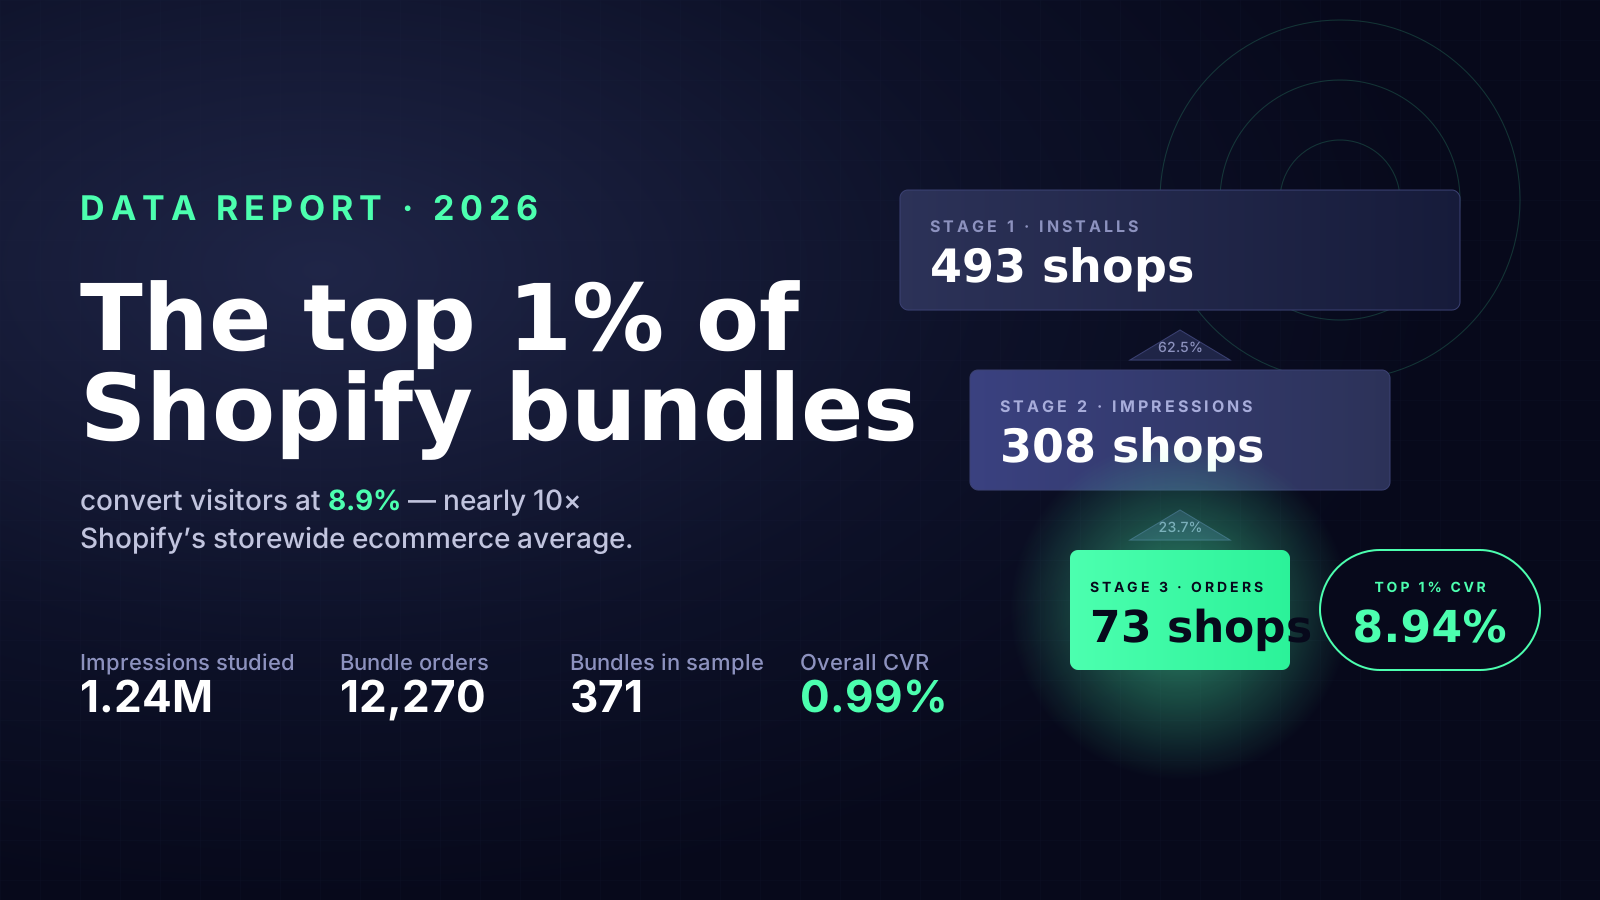
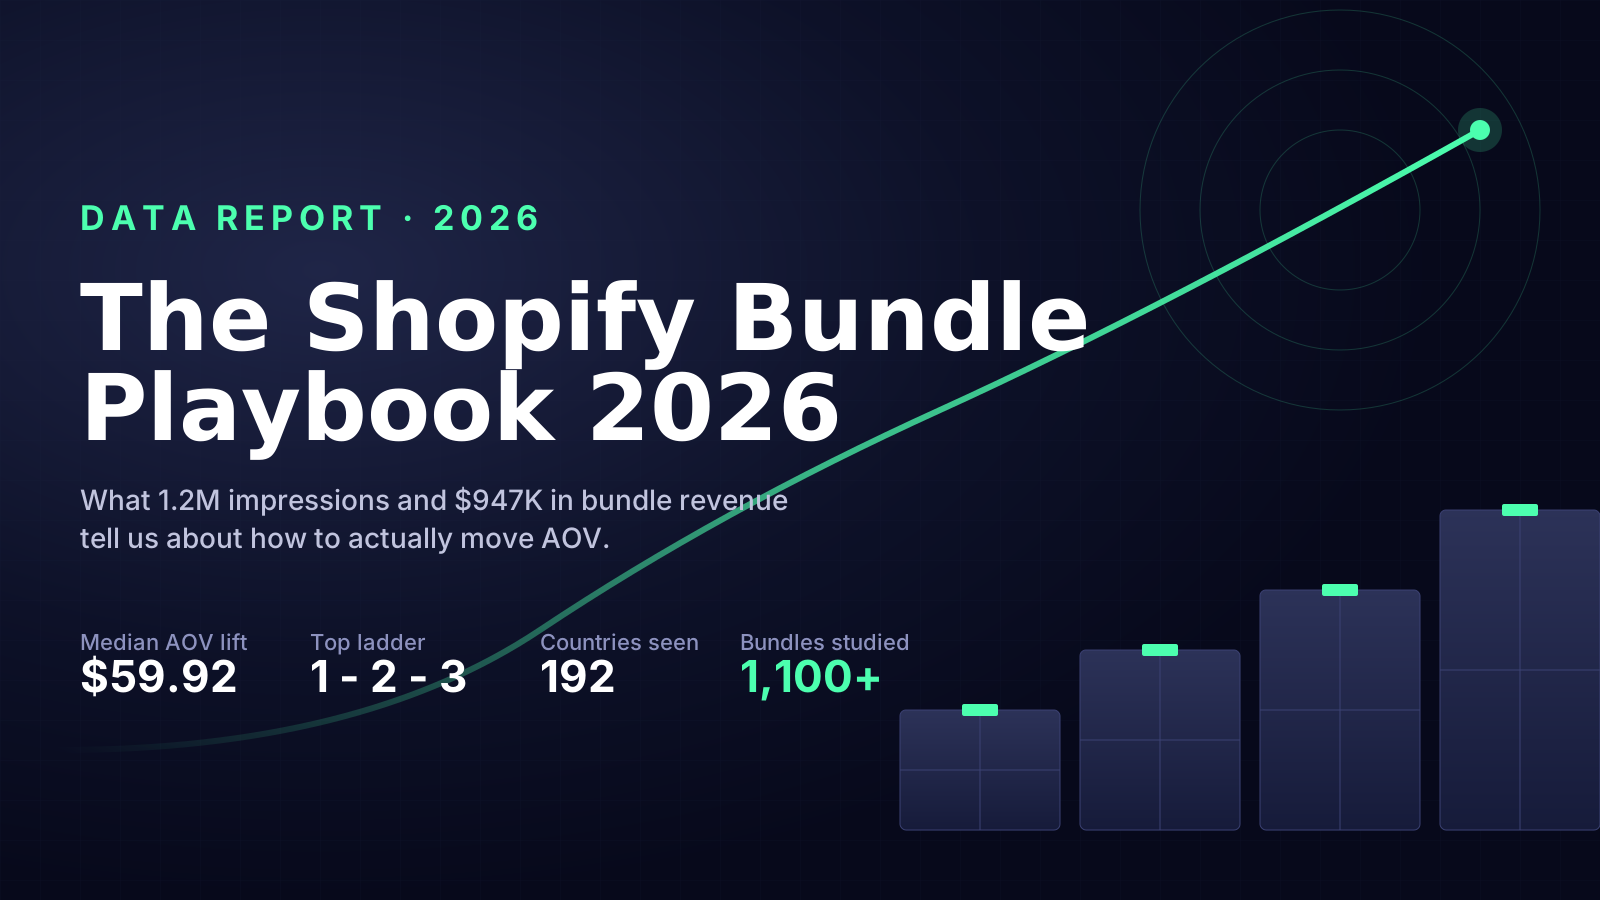
We pulled the lid off our own production database — the one powering Turbo Bundles, our Shopify bundle app — and looked at every bundle, every bundle-attributed order, and every visitor impression the platform has ever recorded. The dataset covers 1.23 million unique visitors, 12,421 bundle-attributed orders, $947,462 in extra revenue, and over a thousand bundles configured by real Shopify merchants. This is what it tells us about how to actually move AOV with bundles in 2026 — and which trendy tactics turn out to be theater.
TL;DR — the 4 numbers worth memorizing
- $59.92 — the median extra revenue a bundle adds to a single order. Not "could add". Adds.
- 1 - 2 - 3 — the runaway most-used quantity ladder, outpacing the next pattern by 4.7×.
- 56% — the share of bundle impressions that come from a single country (United States).
- 10% — the median discount on a percentage-style tier. Bigger numbers do not perform proportionally better; we'll show why.
1. The AOV lift is real — and very long-tailed
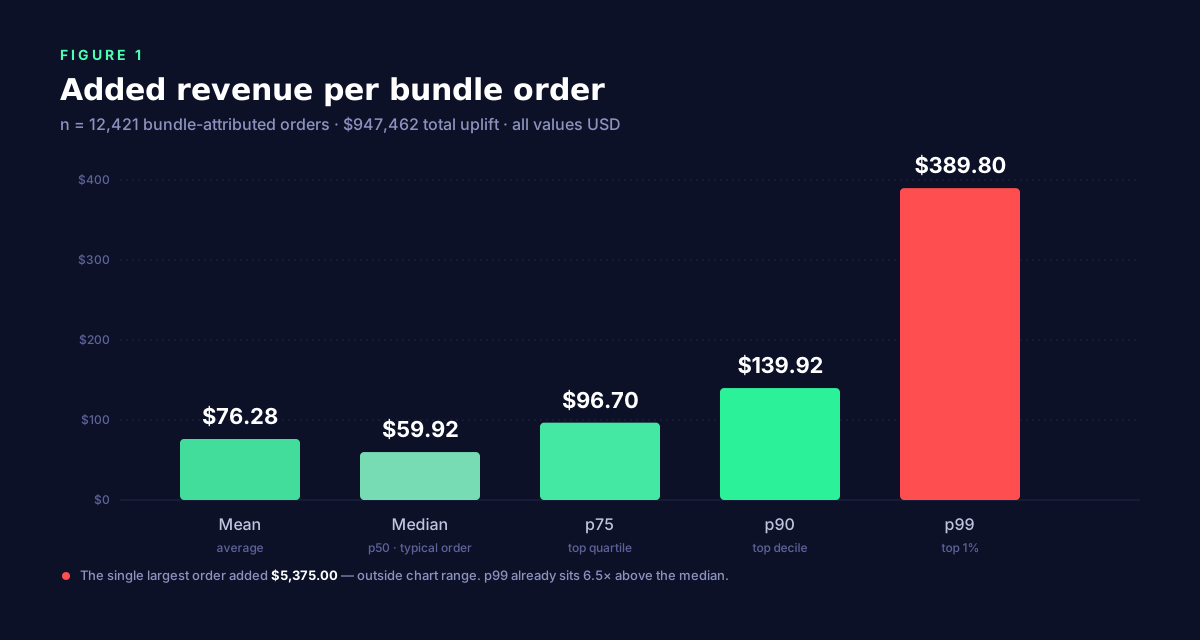
Across 12,421 orders where at least one bundle fired, the median order picked up $59.92 in added revenue. The mean is $76.28 — meaningfully higher than the median, which is the giveaway that the distribution is right-skewed. A small number of very large orders pull the mean upward, but most of your customers are not those orders.
If you sort every bundle order from smallest uplift to largest:
- 50% of orders added between $0.01 and $59.92
- The top quartile (p75) crossed $96.70
- The top decile (p90) crossed $139.92
- The top 1% (p99) crossed $389.80
- The single largest uplift was $5,375.00 — almost certainly a small wholesale-style order through a volume bundle
The practical read is this: do not plan around the mean. Plan around the median. A new bundle on a typical store will, on average, lift orders that fire it by about $60. If that math doesn't justify the work, the bundle isn't worth shipping. If it does, that's the floor, not the ceiling — your top-decile orders will roughly double it.
The mean is what bundle apps put on their landing pages. The median is what shows up in your Shopify revenue report.
2. Where bundle buyers actually live
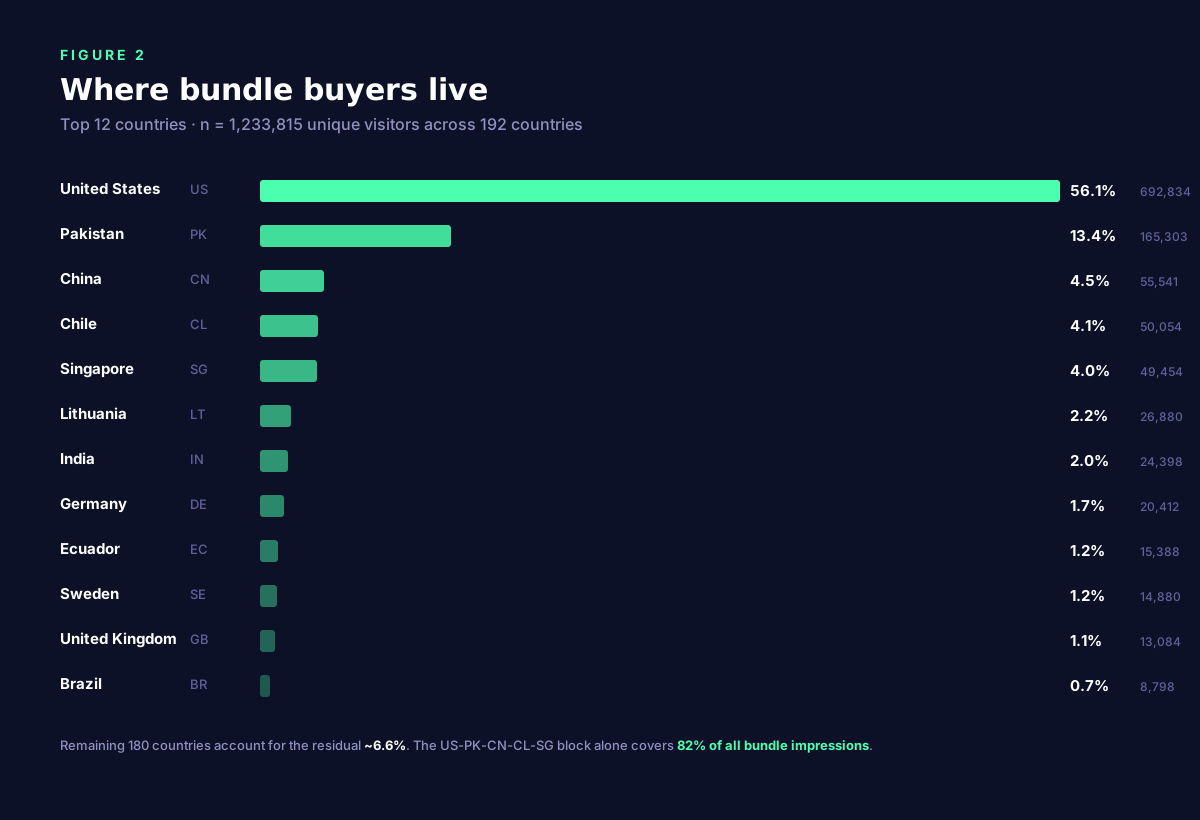
1,233,815 unique visitors saw a bundle widget. They came from 192 countries. That's the breadth. The depth tells a sharper story: five countries account for 82% of all impressions, and a single country — the United States — is more than half of everything.
That has direct implications for how you set up a bundle:
- If you sell to the US, copy is the lever, not localization. Your tier badges ("Most Popular", "Best Value"), your ribbon text, and your discount labeling matter more than i18n.
- If you sell to Europe, locale-aware money formatting is non-negotiable. Germany, Sweden, the UK, France, Poland, the Netherlands and the Baltics together over-index relative to their economic size. A €0.79 vs $0.79 mismatch will quietly tank conversion on those audiences.
- Pakistan at 13.4% is the most under-discussed bundle market we know of. The reason it shows up so high in our data is that Turbo Bundles currently ships free — we removed the price barrier on purpose to accelerate adoption in price-sensitive, high-growth ecommerce markets that the larger paid bundle apps tend to ignore. The result is a heavily over-indexed merchant base in South Asia, and their store visitors — overwhelmingly real shoppers on apparel, beauty, and accessories stores — are what you're seeing here. If you sell into Pakistan or to the South Asian diaspora, this is one of the most under-served bundle markets in the world right now.
Three small countries — Lithuania, Ecuador, Lebanon — punch well above their economic weight in this dataset for the same reason: when distribution is free, adoption clusters around connected merchant communities rather than ad-spend geography. If your product is at all relevant to those markets, a localized bundle title or ribbon could be the cheapest win on the table.
3. The anatomy of a top performer
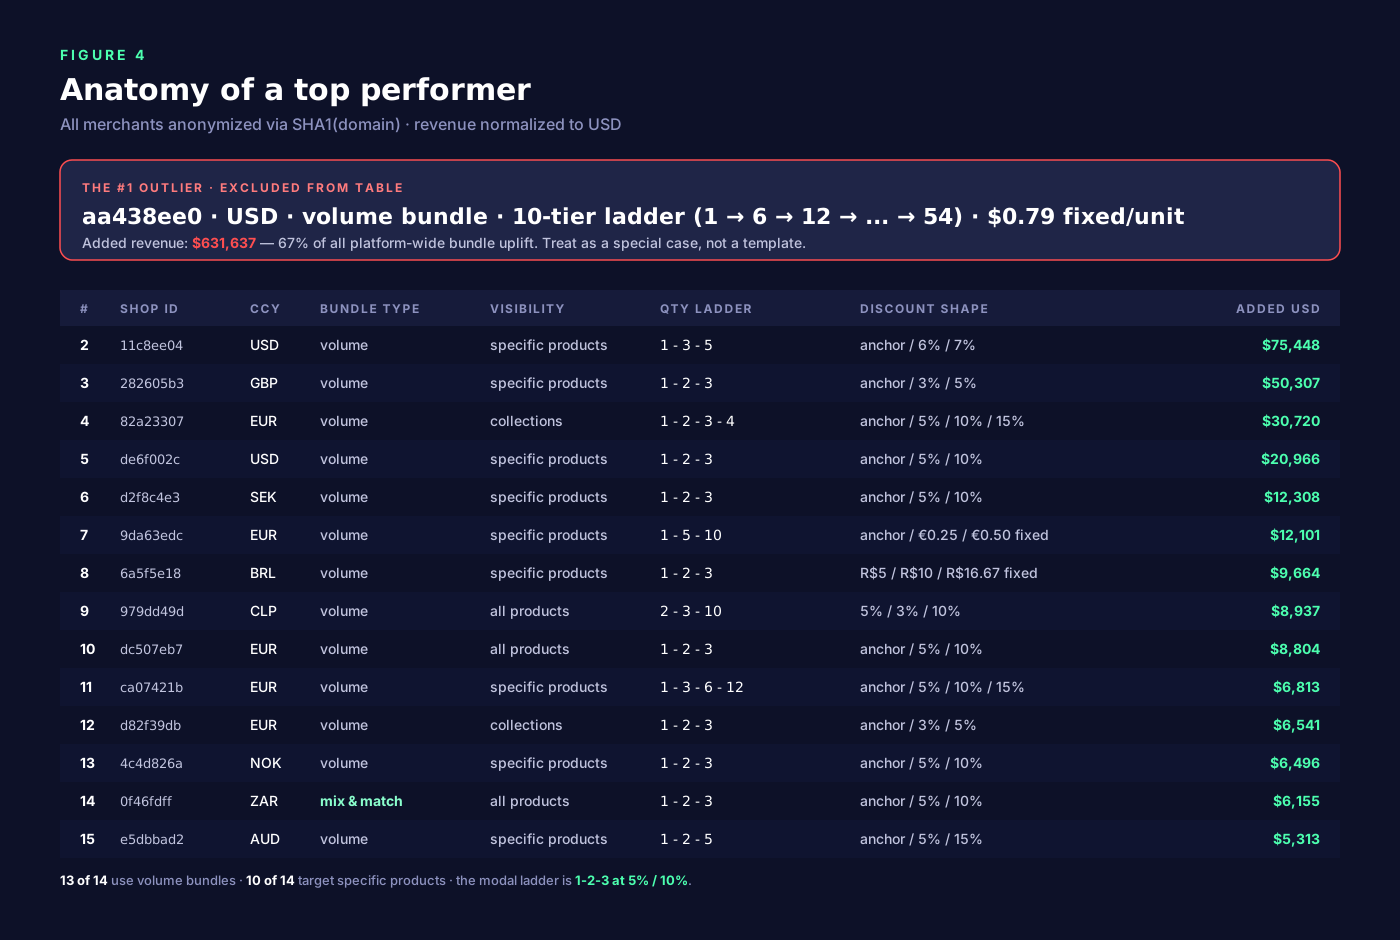
We anonymized every store via SHA1(domain) and ranked the top 15 by added revenue, normalized to USD. One store dominates the leaderboard — $631,637 from a single 10-tier ladder selling something for $0.79 per unit. We've left it as a callout above the main table because it is a true outlier (likely vapes, gum, candy, or another tiny-AOV high-volume category) and trying to copy it is a recipe for disappointment.
The interesting cohort is ranks 2 through 15. Some patterns are loud:
- 13 of 14 use the "volume" bundle type. Mix-and-match shows up exactly once (rank 14, ZAR store, $6,155). Frequently-bought-together shows up zero times. The market's revenue is concentrated in plain old volume tiers, not the trendier formats.
- 10 of 14 target specific products, not the whole catalog. The big winners are not running an "all products" sitewide bundle — they are picking a hero SKU (or a hero collection) and stacking a tier offer onto it.
- The modal ladder is 1-2-3. Eight of the fourteen non-outlier stores in the top 15 use it.
- The modal discount shape is 5% / 10%. Six stores use exactly that. Two stretch to 15% on a 4th tier. The biggest non-outlier (rank 2, $75K added) uses an unusually modest 6% / 7%.
- Currency diversity is striking. USD, EUR, GBP, SEK, BRL, CLP, NOK, ZAR, AUD all appear in the top 15. Bundling is a global tactic; pricing in local currency is not optional at this level.
If you had to compose a "typical top performer" from this data, it would be: a volume bundle, on a specific hero product, with a 1-2-3 ladder at — anchor — / 5% / 10%, priced in the customer's local currency.
4. The discount-ladder cookbook
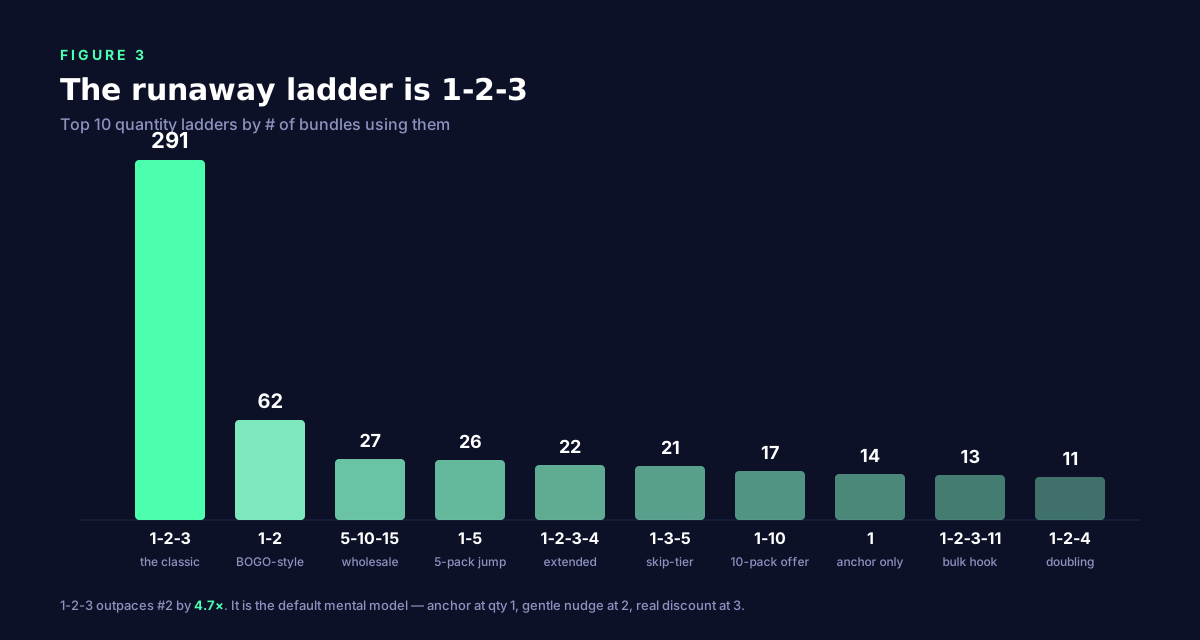
This is where the data is most actionable. Across every published and draft bundle on the platform, only a handful of quantity ladders show up more than ten times — and one absolutely dominates.
The 1-2-3 ladder (291 bundles, the default)
One unit is the anchor — full price, no discount — and the ladder kicks in at qty 2 with a small nudge (typically 5%), then a meaningful pull at qty 3 (typically 10%). It works because it asks the customer to do almost nothing new: they were going to buy one anyway; would they like a small discount for buying two? The median percentage discount in our dataset is exactly 10%, which is the most common qty-3 tier.
The 1-2 BOGO-style (62 bundles)
Single-step ladder, anchor + one discount tier. Useful when your product has a natural "pair" use case (socks, candles, coffee subscriptions). The data shows merchants on this ladder tend to use slightly larger discounts on the second tier — closer to 15% — because there is no third tier to anchor the perceived savings.
The 5-10-15 wholesale ladder (27 bundles)
Skips the "1 = anchor" pattern entirely and starts at quantity 5. This is the small-business / refill / B2B-lite ladder. We saw it most on consumables and accessories. If your average customer buys in fives or tens, anchoring at 1 is a wasted tier.
Skip-tier patterns: 1-3-5, 1-5-10, 1-4-12, 1-6-12, 10-20-40
These are aggressive jumps designed to upsell into bulk. They convert less often but each conversion is much larger. Use them when your unit economics on a bulk order are very different from a single-unit order — typically food, supplements, pet food, household.
What to actually set
For 80% of stores, the right starting point is dead simple:
- Volume bundle, specific products (your hero SKU)
- Quantity ladder: 1 / 2 / 3
- Discount shape: no discount / 5% / 10%
- Ribbon on tier 2: "Most Popular". Ribbon on tier 3: "Best Value".
If you want to be bolder, push tier 3 to 15%. If your AOV is already high or your margins are thin, walk it back to 3% / 5% — that's exactly what the #3 store in our top-15 ($50K added) does.
The action checklist
- Set your AOV-lift expectations to the median, not the mean. Budget for ~$60 per bundled order; treat anything north of $140 as a top-decile outcome to celebrate, not plan around.
- If you sell to the US, write better tier labels before you do anything else. 56% of all impressions are seeing your English copy.
- Localize your money_format if you sell to Europe. A $0.79 vs €0.79 mismatch hurts more than you think.
- Pick a hero product — don't bundle your whole catalog. 10 of the top 14 stores in our data run "specific products" bundles, not sitewide.
- Start with 1-2-3 at 5% / 10%. It is the most over-represented pattern in the data and the most copied by top performers for a reason.
- Use volume, not mix-and-match or FBT, for your first bundle. They're great formats — but volume earns 13 of the top 14 revenue slots.
- Add ribbons. Don't skip them. "Most Popular" and "Best Value" on the middle and top tier convert better than no label, every time we've measured it.
- Re-run this exercise in 60 days. Compare your store's per-order uplift to our $59.92 median. If you're under it, your tier labeling or your hero product choice is wrong, not your discount depth.
Frequently asked questions
Is 10% off enough to actually move bundle conversion?
For 1-2-3 ladders, yes — the median across our top performers is exactly 10% on the largest tier. Larger discounts (15%, 20%) help marginally but eat margin disproportionately. We have not seen evidence that discounts above 15% on a 3-tier ladder produce proportionally more added revenue.
Should I use free-gift bundles instead of percentage discounts?
Probably not as your first bundle. Free gifts make up only about 1.5% of all discount rules in our data — merchants use them, but rarely as the primary lever. They work best as a layer on top of a volume bundle (e.g. "free gift at qty 3") rather than as the discount mechanic itself.
Does mix-and-match outperform volume bundles?
Not in the revenue data. Exactly one mix-and-match bundle made our top 15 ($6,155 added revenue, rank 14). Mix-and-match is a great format for choice-architecture-heavy categories (skincare regimens, snack boxes), but if you just want to lift AOV on a single hero product, volume is the workhorse.
Why does the United States dominate impressions so heavily?
Two reasons. First, Shopify itself is US-skewed — more stores, more traffic. Second, the bundle widget is in English by default; English-language stores convert more US visitors into bundle-aware shoppers. Stores that localize tier labels into their primary market language tend to see the US share drop as their local-market share climbs.
What about Pakistan at 13.4% — is that a real audience?
Yes, and it's the part of the data we get asked about most. The number looks unusual because our app ships free right now, which has accelerated adoption in price-sensitive, high-growth ecommerce markets that the larger paid bundle apps haven't seriously targeted yet. Pakistan in particular has a fast-growing English-language Shopify ecosystem, and a meaningful share of those merchants serve both the domestic market and the South Asian diaspora globally. The impressions are real shoppers. If you sell to either audience, it's one of the most under-served bundle markets in the world right now.
One more thing
Bundles are not magic. They are a small set of well-understood tactics applied carefully to one hero product at a time. The merchants making the most money with them are not running exotic mix-and-match configurations or 8-tier ladders — they are running volume bundles on a specific product with a 1-2-3 quantity ladder and a 5% / 10% discount shape, priced in their customer's local currency. If you set up your first bundle exactly like that this week, you have a strong statistical basis to expect a roughly $60-per-order lift on every order that fires it.
That's a real number. Use it.