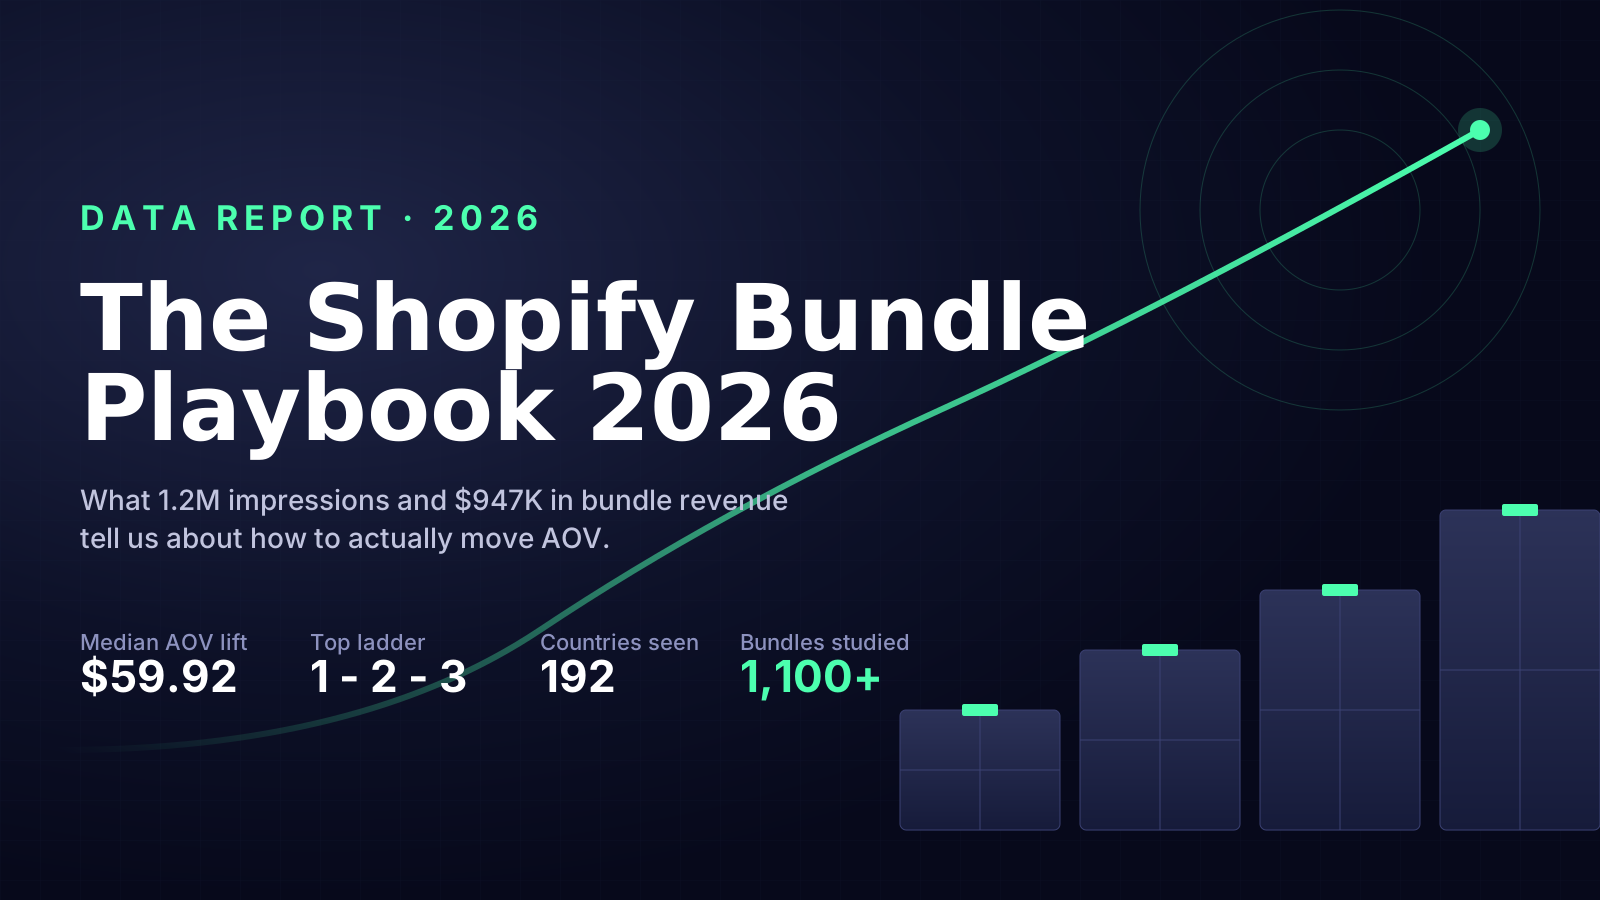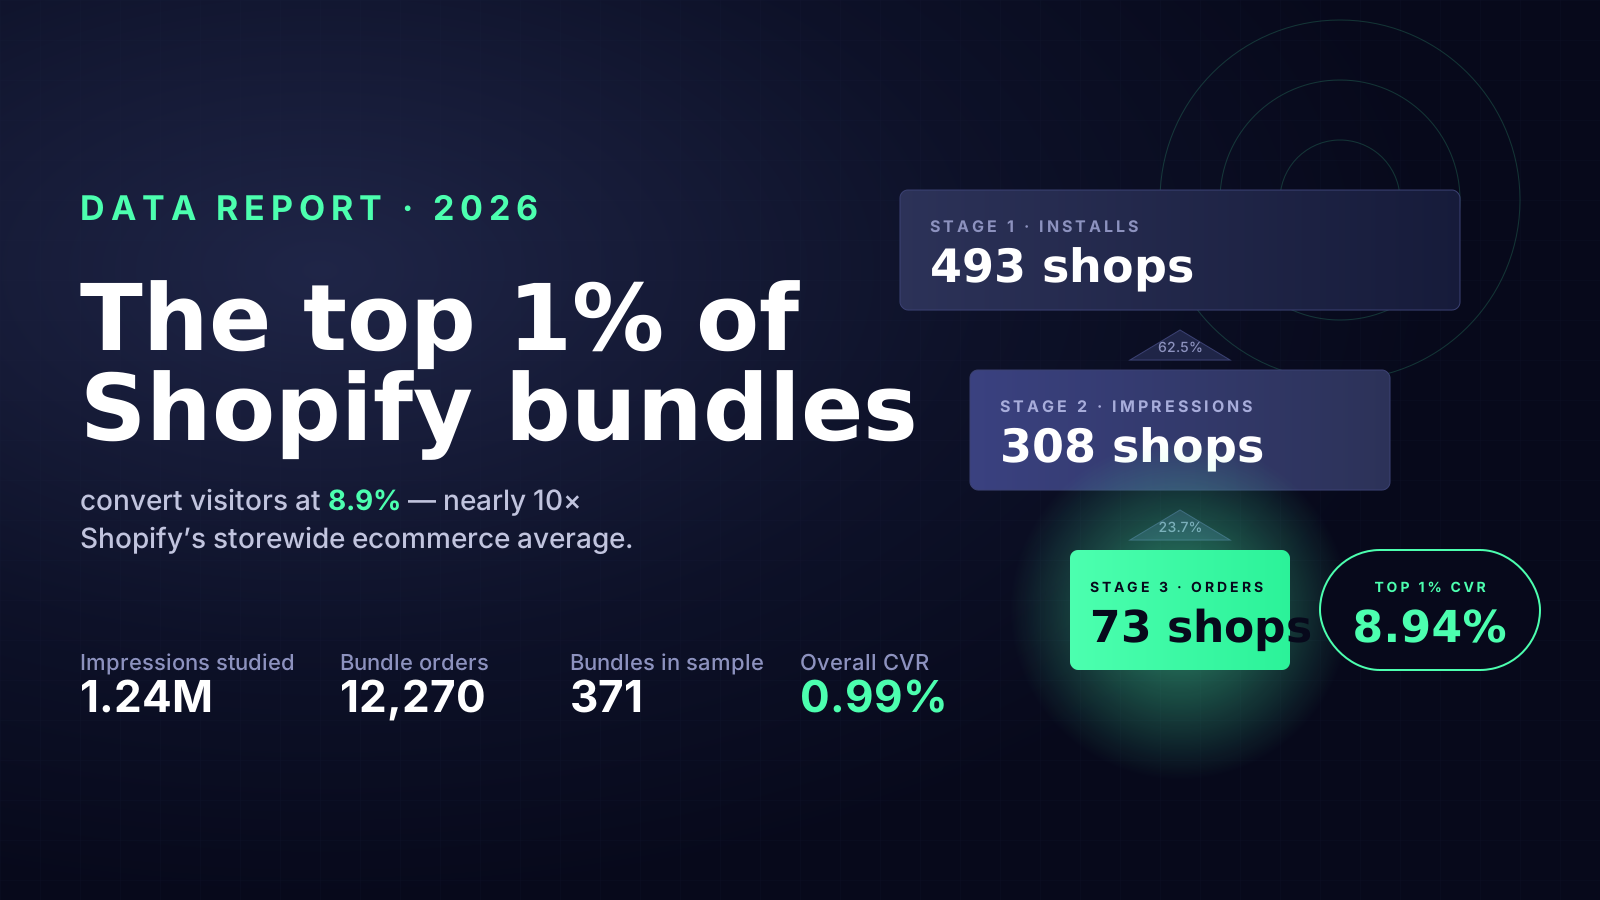
Last week’s Funnel Report answered how many bundles convert. This week we go a layer underneath: what bundles actually look like when they do. We pulled every published bundle in Turbo Bundles — 614 bundles, 11,996 bundle-attributed orders, $44.93 median per-order uplift on the best-performing format — and broke each bundle down by the four dials a merchant has to turn when they create one. The headline is that almost every dial collapses to a single dominant setting. The bundle merchants build at scale is not a creative artefact. It’s a recipe.
TL;DR — the recipe in 4 numbers
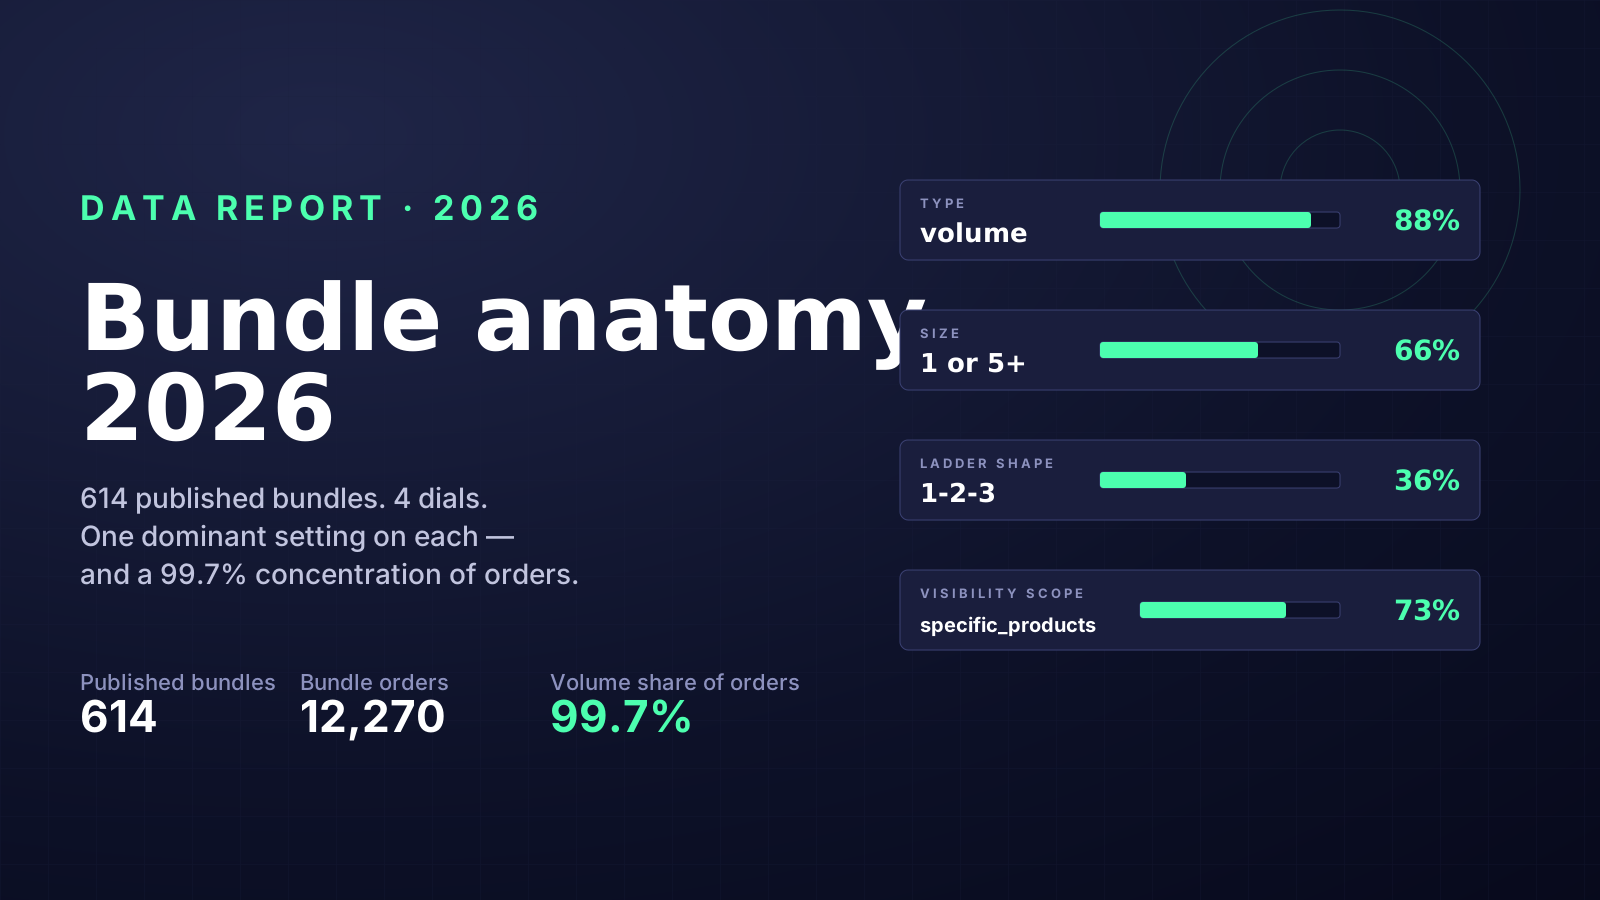
- 88% of all published bundles are
volumetype, and they produce 99.7% of all bundle-attributed orders. Frequently-bought-together and mix-and-match exist on paper; they don’t exist in the order log. - Size is bimodal. 49% of bundles wrap a single product, 16% wrap 5 or more. The 2-4 product middle is empty — 8% of bundles, less than 0.5% of orders.
- 1-2-3 commands 39% of every multi-tier discount ladder ever configured. Three-tier depth in general is 59%. Everything deeper is rare.
- 73% of bundles scope to
specific_products, and that scope earns $44.70 median per-order uplift — 2.2× more than the broadercollection_productsorall_productsalternatives.
This is one of those reports where the data writes the headline for you. There is a clear winning recipe and most merchants who are succeeding with bundles are running it. The rest of this piece breaks down each dial, what the dominant setting earns in dollars, and what the diverging configurations are leaving on the table.
Dial 1 — TYPE: volume bundles are the only format that actually sells
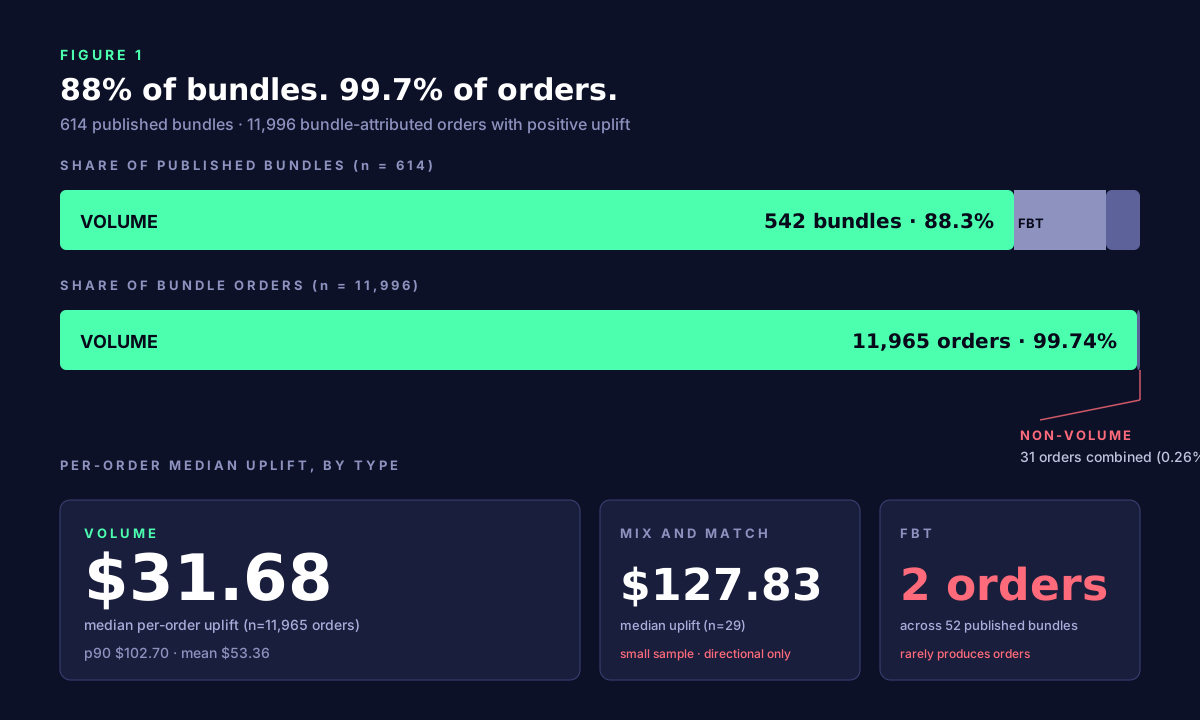
Three bundle types exist in the product: volume (buy more of one product, save more per unit), mix_and_match (buy any N of a curated set), and frequently_bought_together (the Amazon-style upsell). All three are first-class formats in the configuration UI. Shopify’s own discount-types documentation treats them as peers.
In production they are not peers. Volume owns 88% of every bundle ever published and 99.7% of every order ever attributed to a bundle. Frequently-bought-together has 52 published bundles — almost 10% of the catalogue — and has, across the full 16-month order log, produced exactly two attributable orders. Mix-and-match has 20 bundles and 29 orders, with a $127.83 median per-order uplift that looks great on paper, but the sample is too thin (n=29) to claim that as a category-level finding rather than two or three lucky bundles.
FBT’s collapse is the single most surprising finding in this whole report. The format gets coverage in every upsell-and-cross-sell tutorial ever written and merchants reach for it because the language ("frequently bought together") matches Amazon’s. In our data, it’s configured almost like a default — merchants create an FBT bundle as part of trying the app, and then never iterate on it. The fact that volume bundles dominate is partly that they actually work, and partly that merchants who succeed with the first volume bundle they configure keep building volume bundles, while merchants who pick FBT first see no traction and stop. The platform’s creation patterns reinforce themselves.
Practical implication: if you’re starting from zero, build a volume bundle on your single best-selling SKU first. Treat FBT and mix-and-match as experiments you run only after a volume bundle is converting; they are not the safer choice they look like.
Dial 2 — SIZE: bimodal at 1 or 5+ products, and the middle is dead
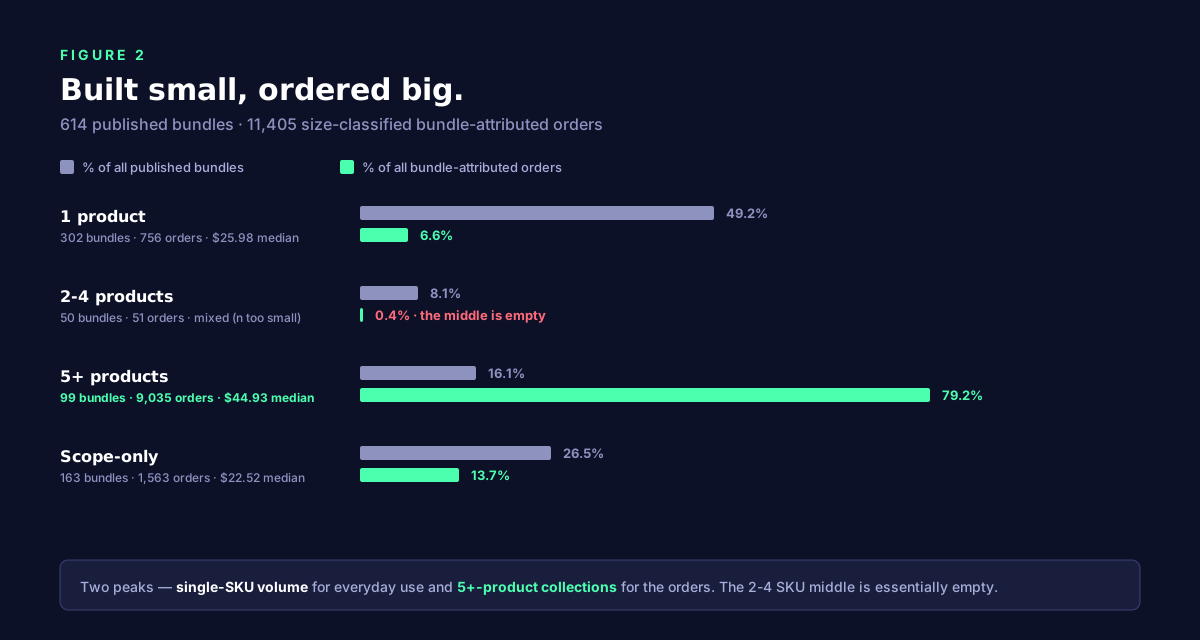
Bundle size — how many distinct products are pinned to a bundle — could in principle be any integer from 1 to a few hundred. In practice it’s two integers: one and five or more. The middle is essentially empty.
Half of every published bundle (302 of 614, 49%) is built around exactly one product. These are the canonical volume bundles — "buy 2 of this mug, save 10%; buy 3 of this mug, save 20%". They’re the cheapest configuration to set up, the easiest one to explain to a shopper, and as we’ll see in the ladder section below, they line up perfectly with the 1-2-3 quantity ladder. Per-bundle they don’t produce much — 302 bundles between them generated only 756 orders, an average of 2.5 attributable orders per bundle over 16 months — but the few that do produce, produce repeatably.
The other peak is bundles wrapping 5 or more products. There are only 99 of these (16% of the catalogue), but they produced 9,035 orders — 79% of every bundle-attributed order on the platform — at a $44.93 median per-order uplift. These are typically curated collections: a five-piece skincare ritual, a ten-pack of variant flavours, a barber starter kit. The biggest single bundle in the dataset has 1,270 products attached.
And the middle? Fifty bundles configured with 2-4 products produced fifty-one orders. Almost exactly one order each. There is no obvious customer mental model for a 3-product bundle that wasn’t already filled by a "starter set" or a "trio" or a curated-collection multi-pack. Merchants who try to split the difference end up with something that’s neither a "buy more, save more" volume promo nor a meaningful curated experience, and the customer treats it as neither.
The 26.5% remainder are "scope-only" bundles — configured with no products explicitly pinned, relying instead on a collection or storewide visibility setting. They produced 1,563 orders at $22.52 median uplift. Less per-order than the 5+ peak but a real chunk of volume, mostly from merchants who run "any 3 from the spring collection" deals.
Practical implication: pick a peak. A single-SKU volume bundle is the right default. A 5+ product curated collection is the right swing. A 3-SKU bundle is almost never the right shape.
Dial 3 — LADDER: 1-2-3 is the answer to a question 39% of merchants asked
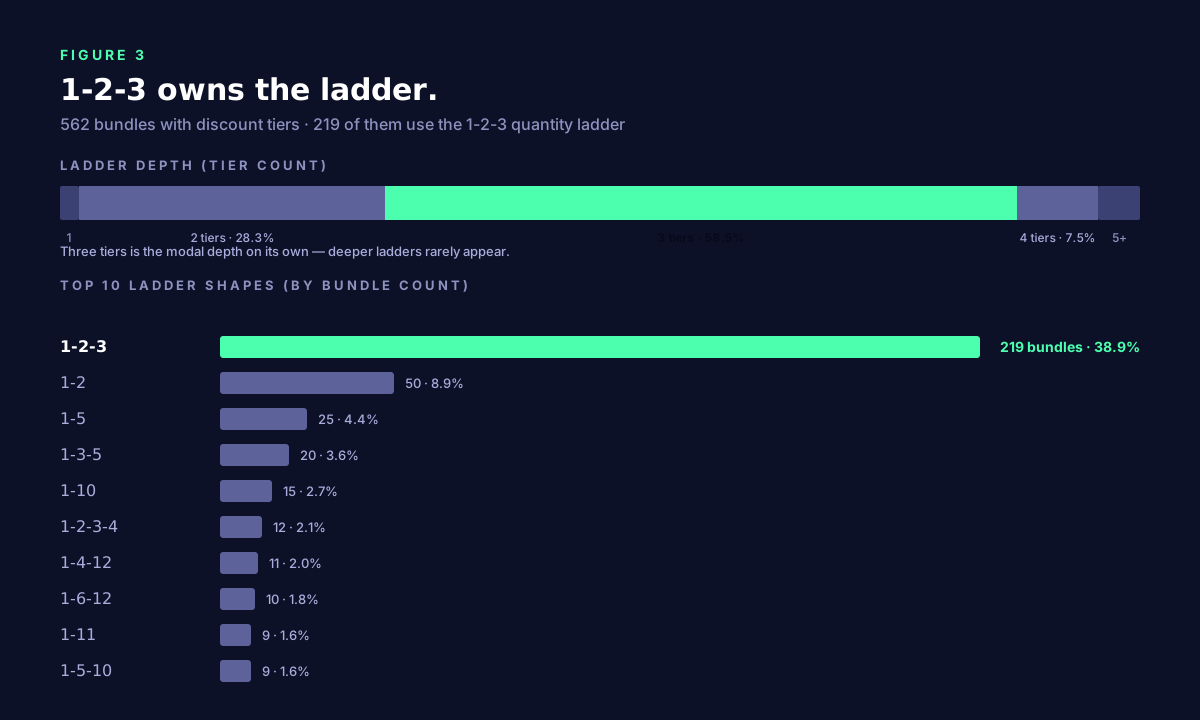
A discount ladder is the staircase of quantity thresholds inside a bundle: "buy 1 / buy 2 / buy 3 at progressively bigger discounts". Each bundle can have anywhere from 1 to a dozen tiers. Three tiers is the canonical depth (59% of every ladder ever configured), and within that, the 1-2-3 shape alone owns 39%.
This finding mirrors what we published in last month’s Bundle Playbook, but now we can quote the entire shape distribution. The 1-2-3 ladder — one unit at full price, two at a small discount, three at a bigger discount — is so dominant that it functionally is what a "Shopify bundle" looks like to most shoppers. The next closest shape is 1-2 (50 bundles), then 1-5 (25), then 1-3-5 (20). Everything below the top ten has fewer than ten configured bundles.
What about deeper ladders? They exist but they don’t pay off. 1-2-3-4 has 12 bundles. 1-2-3-4-5 has 5. Anything beyond a five-tier ladder shows up exactly once or twice in the entire dataset. Researchers at Baymard Institute have written extensively about how decision fatigue degrades conversion when a shopper has to evaluate too many options at once; for bundle ladders, "too many" appears to be more than three tiers.
Practical implication: ship a 1-2-3 ladder as the default. The merchants who win — the ones converting visitors at the 8.94% rate we covered last week — are mostly running 1-2-3, with discounts in the 5-10% / 15-20% / 25-30% range at each step. A four-tier ladder isn’t additive; it’s a distraction.
Dial 4 — VISIBILITY: scope narrow, earn $44.70 instead of $20
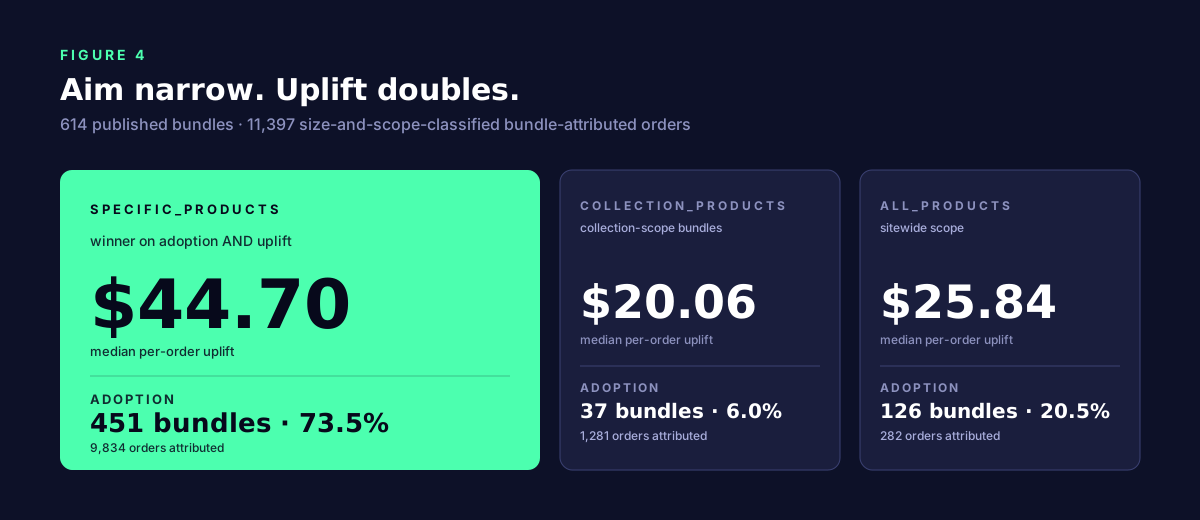
Visibility — whether a bundle shows up on specific product pages, collection pages, or everywhere on the storefront — is the dial most merchants instinctively get wrong on their first attempt. The intuition is "show the bundle everywhere; more impressions, more orders". The data says the opposite.
Bundles scoped to specific_products earn $44.70 median per-order uplift — more than double the $20.06 earned by collection_products scope and 73% more than the $25.84 earned by sitewide all_products scope. Adoption follows the same hierarchy: 451 of 614 published bundles (73.5%) are scoped to specific products, and they account for 86% of bundle-attributed orders. The other two scopes exist mostly as configuration mistakes or as legacy "any product" promos.
The mechanism is well-understood from broader ecommerce research: a shopper who lands on a product page is already past the consideration stage for that product. A bundle pitched on that page is selling them more of what they already want. A bundle pitched sitewide is pitched at shoppers who are still browsing, who haven’t committed to any particular SKU, and who are far more likely to bounce. The bundle isn’t doing extra work; the product page is.
Practical implication: always scope your bundle to the smallest set of products that makes sense. If it’s a bundle on your hero SKU, target only that SKU. The merchants we see converting at the high end are doing exactly this — one bundle per high-volume product, never a sitewide blanket.
What merchants actually bundle — the four clusters in our handle dataset
If you tally up the words appearing in the URL slugs of every product attached to a bundle, the top words by frequency don’t cluster around traditional ecommerce categories. They cluster around four very specific industries:
- South-Asian apparel & bridalwear. The most frequent handle words are "suit" (765 appearances), "embroidered" (532), "palazzo" (343), "anarkali" (235), "wedding". A handful of Indian and Pakistani fashion merchants run massive multi-product volume bundles on traditional-wear sets.
- Men’s grooming and barber supplies. "Barber" (372 appearances across 9 bundles), "blade" (364, 7 bundles), "pressed", "stamped", "bar". These are 1-2-3 volume bundles on shaving creams, beard balms, and clipper kits — the cleanest "1 product, 3 tiers" pattern in the dataset.
- Refurbished IT and storage. "Pack" (456), "drive" (284), "hard" (229), "100" (259), "020" (272), "032" (251). Refurbished-laptop and used-hard-drive merchants run 5+ product bundles to clear inventory at quantity discounts.
- Beauty and hair. "Hair" (259 appearances across 19 bundles), "pulse", "geek", "ice" (227 appearances across 35 bundles), "pink" (29 bundles), "blue" (50 bundles). Bundles here are mostly 2-3 product "kit" sets at the 1-2-3 ladder.
(We’ve retired the original "title-word frequency" idea: the top words across bundle titles are "bundles" (220) and "turbo" (204), which are both Turbo Bundles defaults rather than merchant-chosen language. Handle words turned out to be the much better signal.)
The composition heuristic — if you had to spin one bundle today
Stack the four dials in the order of evidence strength and you get a single default configuration that lines up with where the orders actually are:
- Type:
volume. Not FBT, not mix-and-match, not until you have at least one volume bundle converting. - Size: 1 product (your hero SKU) if you’re starting; 5+ products (a curated collection) if you have one already.
- Ladder: 1-2-3 quantity tiers. Three steps. No deeper.
- Visibility:
specific_productson exactly the product the bundle targets.
This is not "the bundle we recommend"; it’s "the bundle the data says merchants are succeeding with". The configuration is the same recipe a barber-supply store in Pakistan and a refurbished-laptop seller in California have already converged on. If you’re configuring your first bundle and you don’t have a strong reason to diverge, ship this and iterate from there.
Frequently asked questions
A few questions we’ve fielded since the funnel piece dropped last week.
If volume bundles are 99.7% of orders, why does Turbo Bundles even support FBT and mix-and-match?
Because the configuration space matters even when the order share doesn’t. FBT in particular is the format closest to Amazon’s "frequently bought together" recommendation tile, which sets a customer expectation. A merchant who is told "Turbo Bundles can’t do FBT" assumes the product is incomplete; supporting all three formats is part of the trust contract. Whether merchants use them well is downstream of that.
Is the mix-and-match $127.83 median uplift a real finding?
Provisionally, yes — but with a small-sample disclaimer (n=29 orders) we’d retract if we saw a bigger denominator and the median dropped. Mix-and-match is the only format other than volume with positive attributed orders right now, and at the per-order level it earns 4× the volume median. We’ll keep tracking this as adoption grows.
How does the 1-2-3 ladder compare to a percentage-based discount that says "buy any quantity, take 15% off"?
We don’t cleanly separate those two cases today — an "any quantity, 15% off" promo is stored as a single-tier ladder, and we group it with every other single-tier bundle. That 1-tier population is small (10 bundles total) and the orders are too few to compare statistically against 1-2-3 (219 bundles).
I configured a bundle with a 1-5-10 ladder. Should I move to 1-2-3?
Almost certainly not, if your bundle is on a product where customers do buy 5+ units (variant flavour packs, supplements, restock-heavy SKUs). 1-5-10 makes sense when the customer’s usage pattern has a natural quantity jump — "I’d buy 1 to try, 5 to stock my shelf, 10 to share". 1-2-3 makes sense when the quantity gradient is smooth and any extra is a marginal save. Match the ladder to the product, not the other way around.
Where’s the analysis on which times of day or week bundles convert?
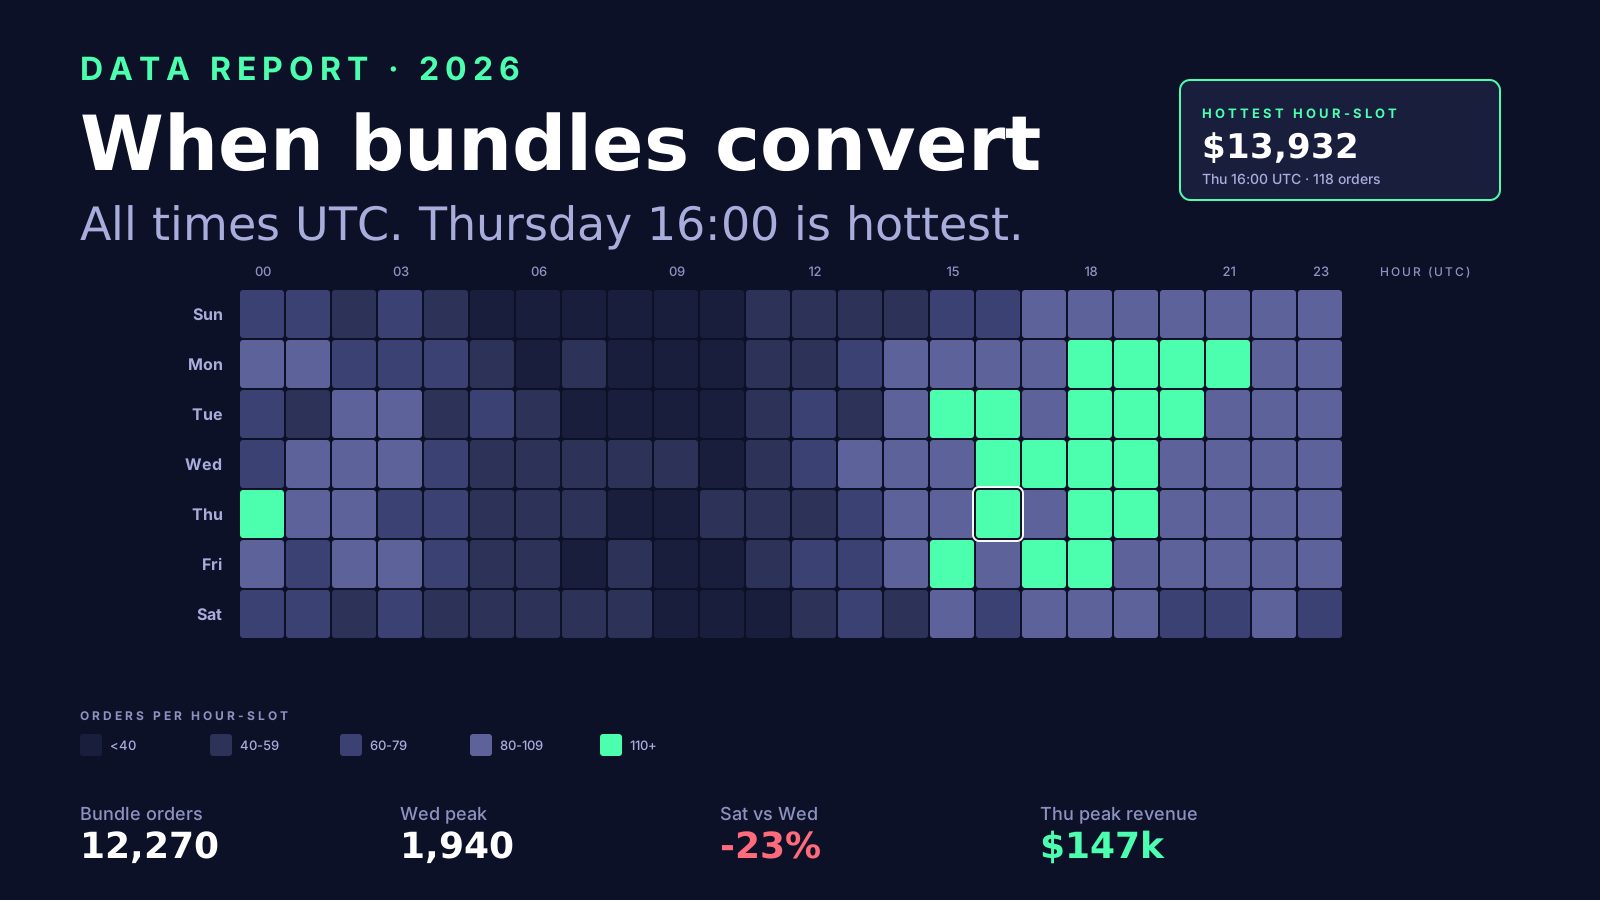
That’s next week’s report — "When Bundles Convert: 2026 Timing Report", publishing 2026-06-02. We have 12,270 bundle-attributed orders mapped to UTC hour-of-day and day-of-week and there are some clear windows. Subscribe for the drop or check back next Tuesday.
Where do the numbers come from?
Every number in this article is computed from the production Turbo Bundles database as of 2026-05-12. 614 published bundles, 11,996 orders with positive attributed uplift, 16-month window. Anonymized at the shop level; no merchant-identifying information surfaced in this piece.