Last month we published The Shopify Bundle Playbook 2026 — the macro picture of what bundles look like across our production database. This week we go a layer deeper, into the metric merchants actually pay rent with: conversion rate. We pulled every unique-visitor bundle impression and every bundle-attributed order from Turbo Bundles — 1,241,215 impressions, 12,270 orders, 614 published bundles — and computed the per-bundle conversion rate. The headline is unflattering for the median bundle and stunning for the top 1%. This is what separates them.
TL;DR — the four numbers worth memorizing
- 0.989% — the global impression-to-order rate across every bundle on the platform. Roughly two-thirds of Shopify’s often-cited storewide 1.4% average, which is normal for an upsell-style widget.
- 0.0% — the median per-bundle conversion rate. Half of all bundles with enough traffic to measure converted nobody. Bundles do not auto-perform; somebody has to set them up right.
- 2.25% — what the top-decile bundle (p90) converts at. Already 2.3× the global rate.
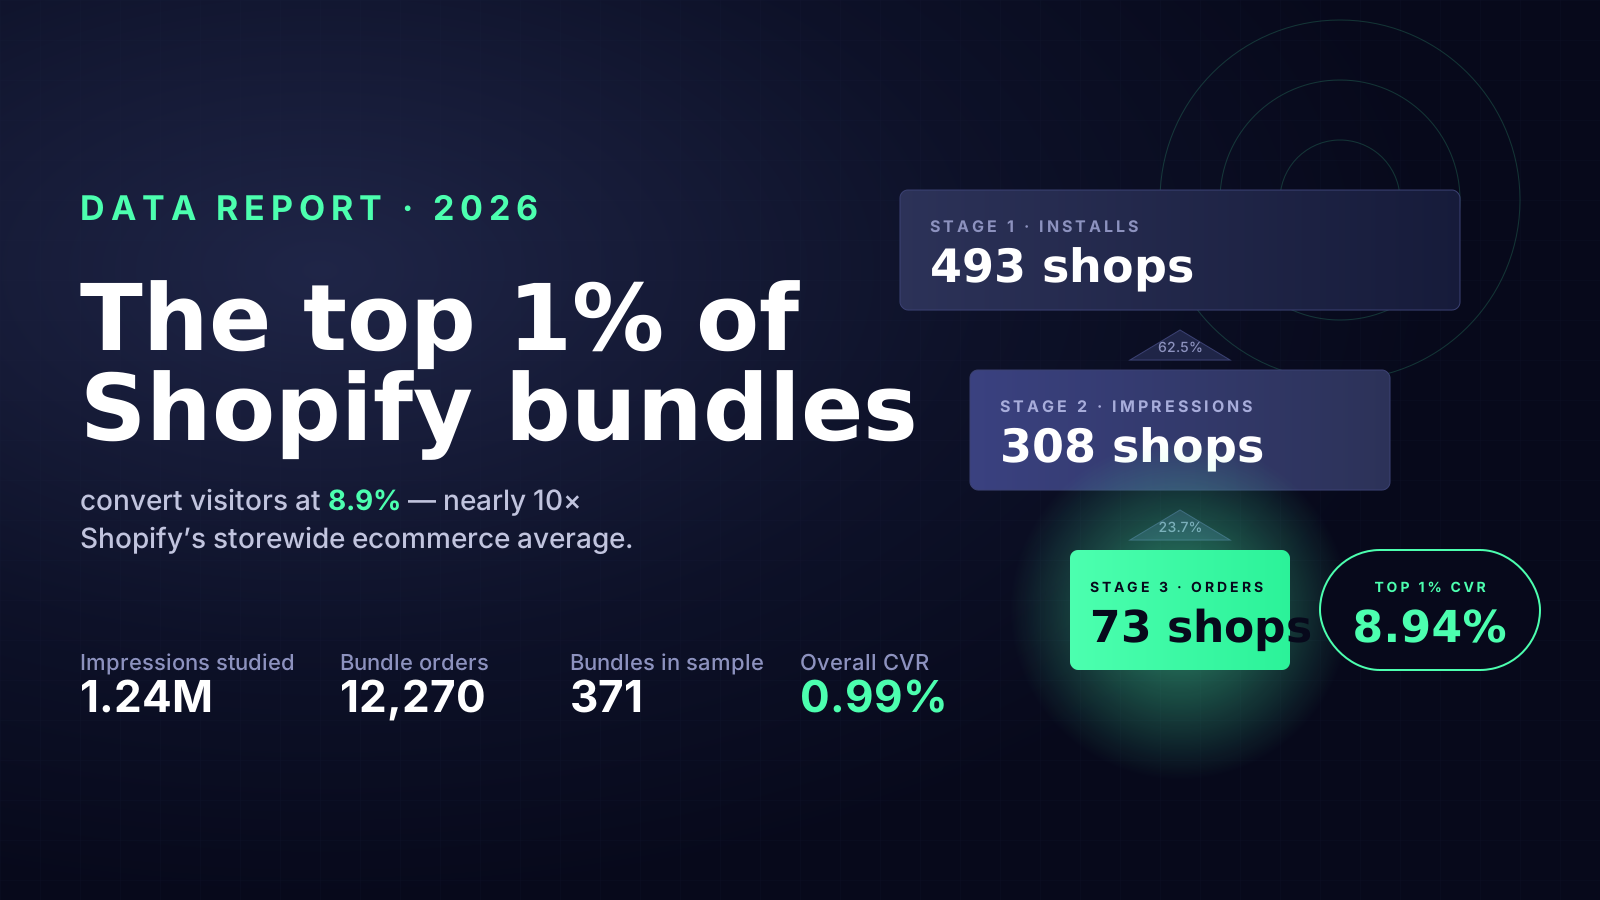
- 8.94% — what the top 1% (p99) converts at. Nine times the global average, and almost six times Shopify’s storewide ecommerce benchmark. The recipe is replicable; the gap is execution.
1. The shop-level funnel is leakier than the storewide funnel
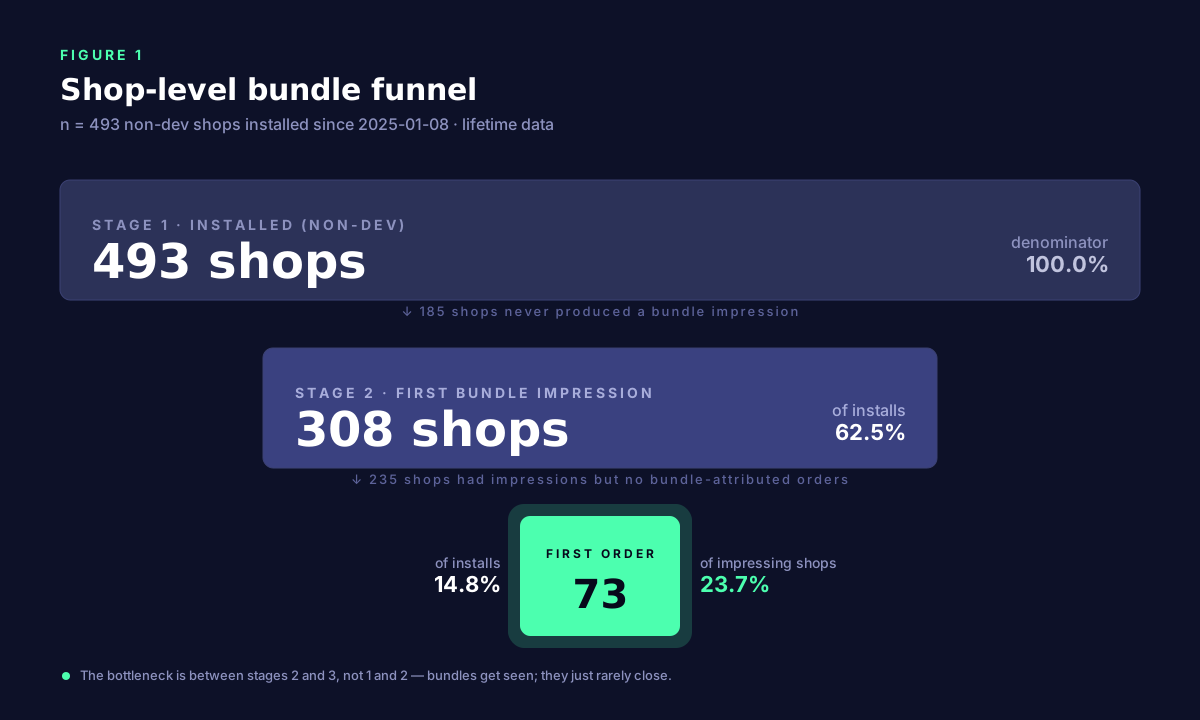
Before we get to per-bundle conversion math, the shop-level numbers tell their own story. 493 non-development Shopify stores have installed the app. Of those, 308 (62.5%) ever generated even one bundle impression — meaning the widget rendered on a product page and a visitor saw it. Of those, 73 stores (14.8% of installs, 23.7% of impressing shops) ever generated a bundle-attributed order.
That second bottleneck — the 308-to-73 step — is where the actual money is left on the table. These are not stores that failed to install the app. They are not stores that hid the widget. They are stores whose visitors saw a bundle and walked past it. Some of those stores have low traffic and would convert eventually with more impressions; some have bundles configured in a way that doesn’t convert at any volume. The per-bundle CVR distribution that follows tells us which is which.
The widget reaching the visitor is the easy part. Getting the visitor to take the offer is the entire problem.
2. The median bundle converts at zero
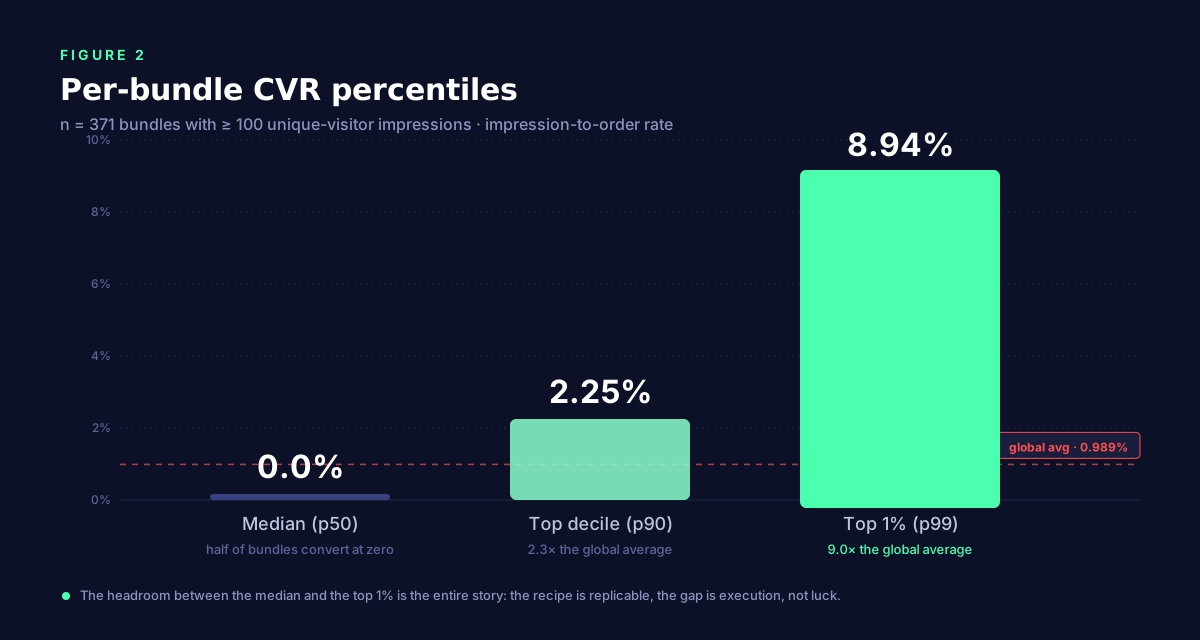
We filtered to bundles with at least 100 unique-visitor impressions so the rates are meaningful, leaving 371 bundles in the sample. Then we computed the impression-to-order rate per bundle and plotted the percentiles.
- Median (p50): 0.000%. Half of all bundles in the sample have not converted a single visitor into a bundle-attributed order. Not "barely converted." Zero.
- Top decile (p90): 2.25%. Already 2.3× the cross-bundle global rate of 0.989%. This is roughly Shopify’s storewide ecommerce conversion benchmark.
- Top 1% (p99): 8.94%. Nine times the global average. Higher than most direct-mail campaigns; comparable to a well-run email upsell sequence.
The 0% median needs context, not panic. A bundle exists on Shopify the moment a merchant clicks "Save" in the admin — it doesn’t yet have a hero product, a thoughtful tier ladder, or a tested ribbon. Most stores that look like our median bundle are stores that installed the app, made a draft bundle, never finished configuring it, and walked away. That’s not a bundle problem; it’s an onboarding problem, and we’ll come back to it in section 3.
What matters is the headroom. Between the median bundle and the p99 bundle, there is an 8.94-percentage-point gap. That gap is not luck. The top 1% are not converting through some structural advantage no one else has. They’re using a small set of repeatable patterns — and our Article 1 data shows exactly what those patterns are.
3. What the top 1% do differently
Three patterns separate high-converting bundles from the median. None of them are exotic. All three are visible in the Bundle Playbook 2026 data and confirmed by the per-bundle CVR distribution above.
They use the volume bundle type, not mix-and-match or frequently-bought-together
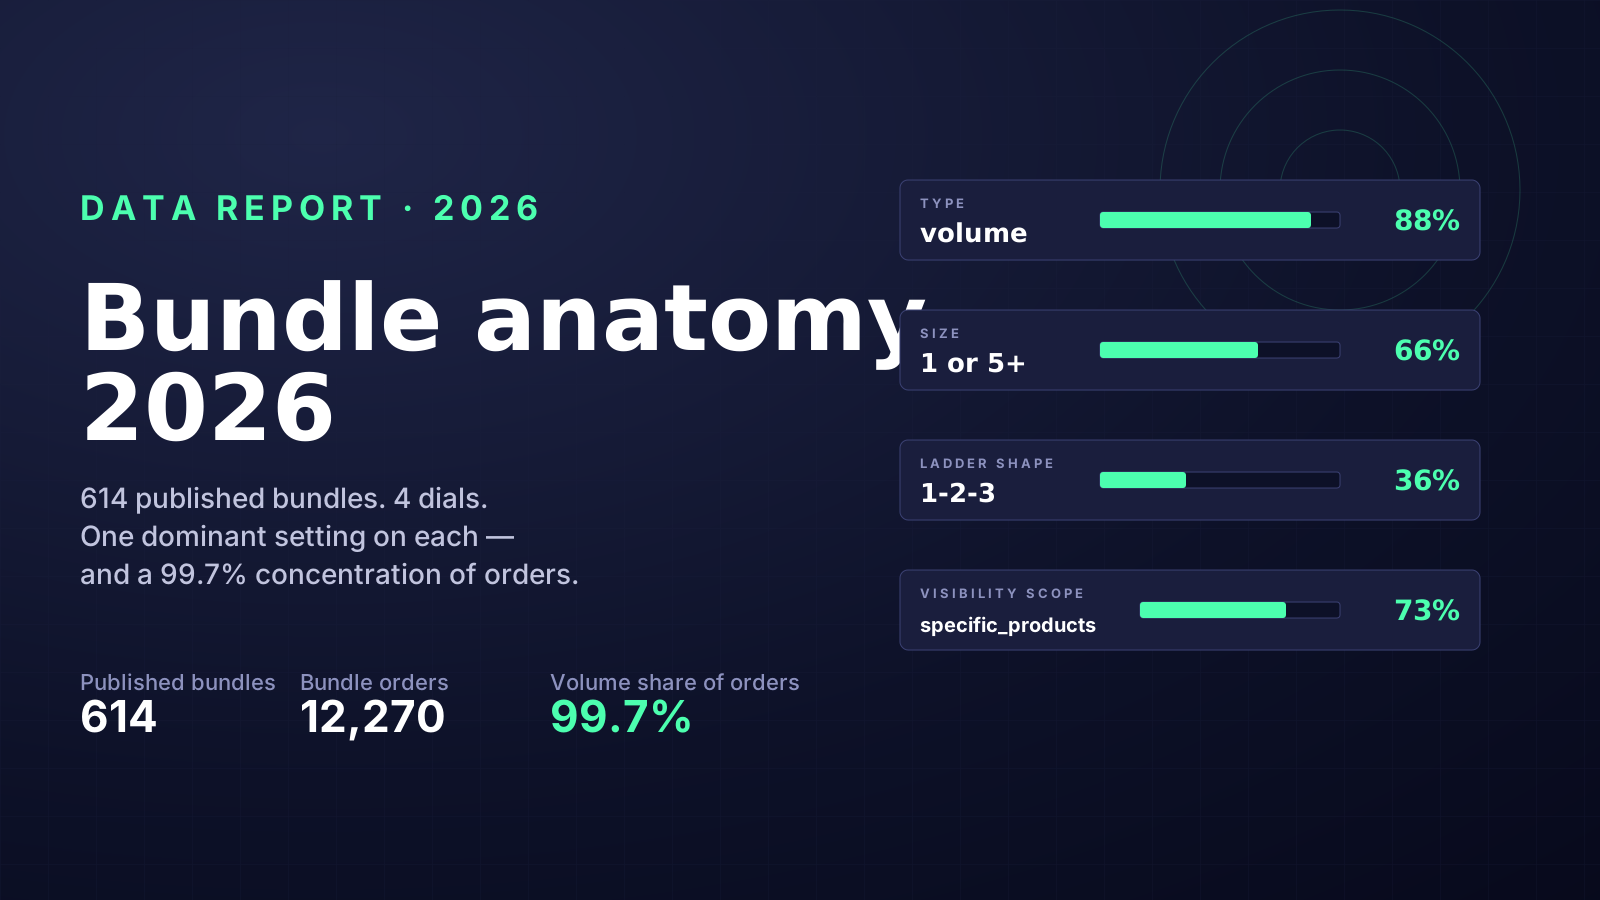
88% of all published bundles are volume bundles. They also own 99.7% of all bundle-attributed orders — 11,965 orders against 29 for mix-and-match and 2 for frequently-bought-together. FBT in particular rarely produces orders in practice: 52 bundles created across our merchant base, ~2 attributable orders generated. That’s not a recommendation against the format philosophically — it’s an observation that the merchants who configured FBT bundles either set them up incorrectly, on the wrong products, or both. Until you have a high-converting volume bundle as your baseline, the other formats are a distraction.
They target specific_products, not their whole catalog
9,834 of the 11,400 bundle-attributed orders we can break out by visibility came from bundles scoped to specific products. Median uplift on those orders: $44.70. The same query on collection_products bundles: $20.06 median, 2.2× lower. On all_products sitewide bundles: $25.84 median. Specific-product bundles win on both adoption (73% of published bundles) and uplift. Pick your one or two hero SKUs. Stack the bundle on those. Don’t blast the whole catalog.
They use the 1-2-3 quantity ladder — and so do 35.7% of all published bundles
The Bundle Playbook documented this last month and the 2026-05-12 re-pull confirmed it tighter: 219 of 614 published bundles (35.7%) use exactly the 1-2-3 quantity ladder. The next most common (1-2) appears on 50 bundles. The third (1-5) on 25. 3-tier ladders in total dominate (329 of 559 bundles with multi-tier ladders, 58.9%). If you are setting up your first bundle this week and you don’t know what ladder shape to use, use 1-2-3 with no-discount / 5% / 10%. That is the most over-represented pattern in the data and the most copied by top performers for a reason.
Sum of these three: volume bundle, on a specific hero product, with a 1-2-3 ladder at 5%/10%. That’s not "the average bundle." That’s the recipe behind the top 1%.
4. What the flow looks like at scale
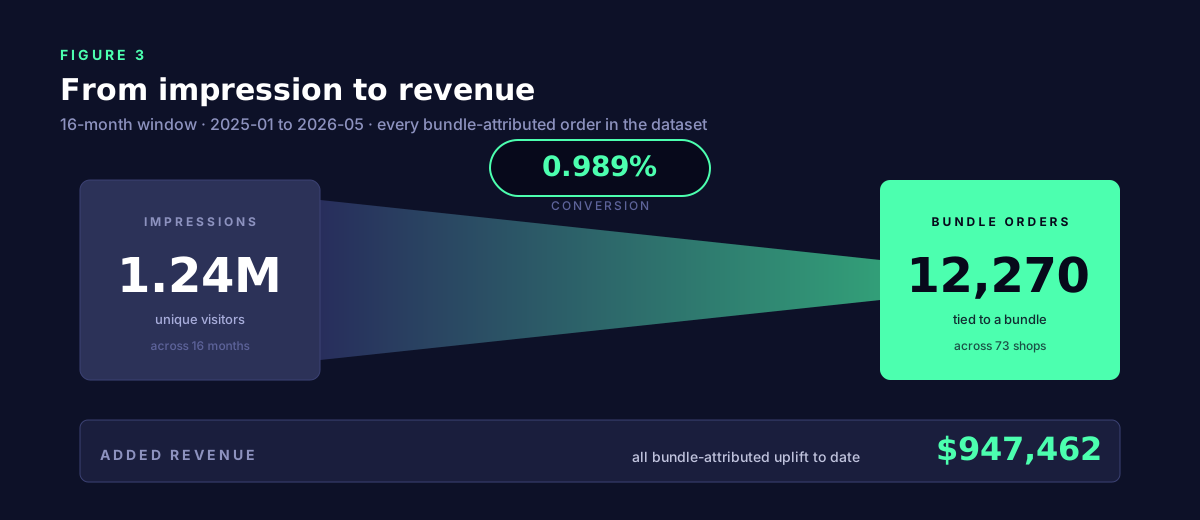
Zoom out from the per-bundle distribution and the volume math is impressive. 1,241,215 unique visitors saw a bundle widget in the 16-month window from January 2025 to May 2026. 12,270 of them placed a bundle-attributed order. Total added revenue: $947,462. That’s ~$77 of uplift per converted visitor, ~$0.76 of uplift per impression on average, with the heavy lifting concentrated in the top 1% of bundles.
The flow chart above is intentionally not a conversion-rate optimization manifesto. It’s a reminder that even at a "bad" 1% conversion rate, the math at Shopify scale still moves the needle for the stores that get past stage 3 of the shop-level funnel. The merchants making $50K+ in bundle uplift are not converting at exotic rates — they are converting at 2-9%, on hero SKUs, with thousands of visitors a month seeing the widget. Volume plus discipline.
5. Sidebar: 95.6% of mounted widgets actually render
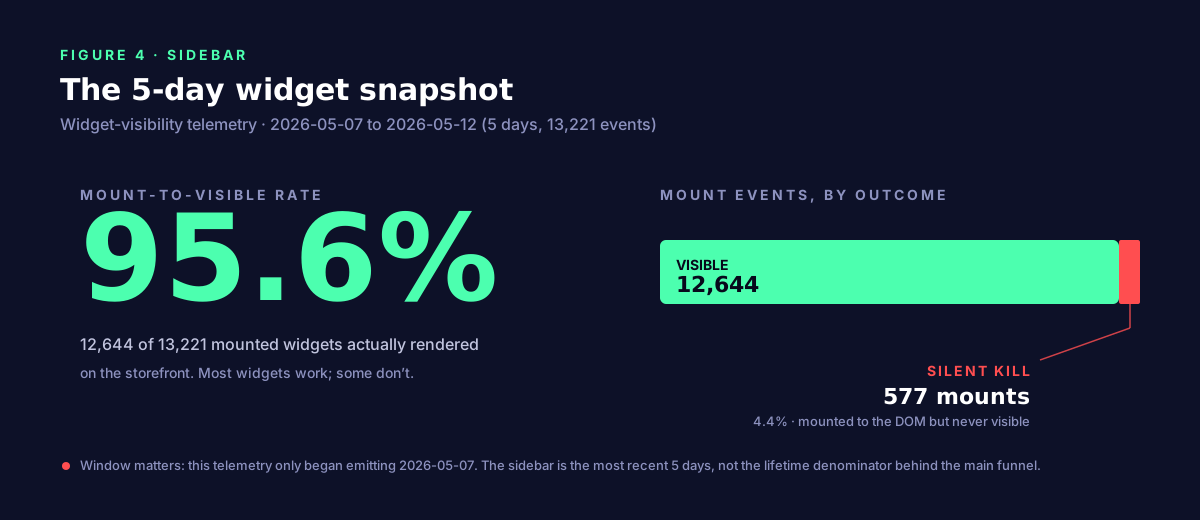
One last data point worth surfacing, because it’s new. On 2026-05-07 we shipped a layer of widget-visibility telemetry that records every attempt the bundle widget makes to render on a merchant’s storefront. In the first 5 days, it captured 13,221 mount events. Of those, 12,644 became visible (95.6%) — the widget mounted to the page and the browser successfully rendered it on-screen. 577 events (4.4%) mounted invisibly: technically present in the page’s HTML, never seen by the shopper.
This is the "silent-kill" rate. It’s the only stage in the funnel where we can measure something the merchant can’t see at all — their admin shows the bundle as installed and configured, their theme renders the section, but for ~1 in 23 page loads the widget is there and inert. Common causes: a theme-level display: none rule, a competing app injecting CSS that hides our section, a viewport too narrow to trip our visibility threshold, or a page builder mounting the section into an offscreen container. If your widget is configured correctly and you’re still seeing 0 impressions in our admin, this is the likely cause — not the configuration.
This visibility window is only 5 days old as of writing, so the sidebar is a snapshot, not a trend — treat the 4.6% as a current point-in-time number, not a stable rate. For now: 96 out of every 100 mounts work, 4 don’t, and the 4 are usually a theme conflict, not a bundle problem.
The action checklist
- Diagnose where your store sits in the shop-level funnel before optimizing anything. If you have zero bundle impressions, it’s a widget-placement problem (see section 5). If you have impressions but zero orders, it’s a bundle-configuration problem (see section 3).
- Set CVR expectations honestly. A well-configured first bundle should land between 1% and 3% impression-to-order conversion. Above 3% is real outperformance.
- Use a volume bundle. Specific products. 1-2-3 ladder. The top 1% pattern, summarized in one line. Use it for your first bundle and ignore the trendier formats until you’ve hit baseline conversion.
- Pick one hero SKU. 73% of all published bundles target specific products, and they generate $44.70 median uplift vs $20-25 for sitewide bundles. Don’t bundle your whole catalog.
- Discount shape: no-discount / 5% / 10%. Tier 2 = "Most Popular" ribbon. Tier 3 = "Best Value" ribbon. The Bundle Playbook covers why these specific percentages outperform.
- If you have impressions but no conversion after 2,000+ views, change one thing at a time. Hero product first, then ribbon text, then discount shape. Don’t change everything at once or you’ll never know what worked.
- Re-run this math in 60 days. Compare your per-bundle CVR to our 0.989% global average. Above 2.25% means you’re top-decile. Above 8.94% means you’re top-1% and you have a playbook worth scaling to a second product.
Frequently asked questions
Is 0.989% a good conversion rate for a bundle widget?
It’s about two-thirds of Shopify’s often-cited 1.4% storewide ecommerce average, which is the right order of magnitude for an upsell-style widget rather than a primary purchase path. Baymard’s industry research shows that even well-optimized ecommerce upsell elements rarely exceed 5% click-through on average; converting all the way to an attributed order at 1% on a passive widget is in line with that. Top performers (p90+) are running their bundle widget like a real conversion element, not a passive plug-in.
Why is the median bundle CVR exactly 0%?
Because half of bundles with 100+ impressions have never had a single bundle-attributed order, and 0% is what the percentile function returns when half the distribution is exactly zero. The likely explanations: draft bundles a merchant configured incompletely; bundles on cold inventory the merchant forgot about; or bundles configured on products that have impressions but very little buying intent (high-traffic SEO pages, for example).
What does "bundle-attributed" actually mean?
An order is "bundle-attributed" if at least one of its line items came from a bundle. We tag the line items at the moment Shopify’s order webhook fires for a customer whose cart contained a bundle-discounted item, so attribution is server-side and not dependent on cookies. Free-gift bundles use a different attribution path internally and are excluded from this count — see the Bundle Anatomy 2026 piece (publishing next Tuesday) for the breakdown.
Does the 8.94% p99 mean my bundle can hit 8.94%?
Yes, but only if you replicate the recipe behind it. Look at section 3: volume bundle, specific products, 1-2-3 ladder. Stores that use all three of those patterns are dramatically more likely to land in the top decile than stores that combine them with other settings. The 8.94% is not a ceiling we drew — it’s the actual conversion rate of real bundles on real stores right now.
What if my bundle has impressions but zero orders for weeks — is it broken?
Probably misconfigured rather than broken. Three diagnostics, in order. First, check your bundle is volume type and uses the 1-2-3 quantity ladder, not the FBT or sitewide format (those have 1/40th the order share). Second, check it targets specific_products scoped to your hero SKU, not your whole catalog. Third, on the storefront, scroll the product page and verify the widget is actually visible — not technically mounted, but visible (see the sidebar in section 5). If all three are correct and you still have zero orders after 2,000+ impressions, the bundle is on the wrong product and you should move it.
Where can I see all of this for my own store?
Inside the Turbo Bundles admin, the Statistics tab shows per-bundle impressions and per-bundle attributed orders. Divide one by the other to get your per-bundle CVR. Compare to the percentiles in section 2 to see where you sit.
One more thing
The unflattering truth about most bundle widgets is that they were installed, half-configured, and then forgotten — which is the same fate as most shop features added through any app store, anywhere on the internet. The flattering truth is that the merchants who treat their bundle as a real conversion element — pick a hero SKU, run the volume format, use the 1-2-3 ladder, watch the data — are converting at 9 times the platform average. The recipe is short. The gap between knowing it and following it is most of the difference between $0 and $50,000 of bundle uplift.
Use the recipe.